
Anemia
Model Inputs \(\rightarrow\) Biological Parameters \(\rightarrow\) Anemia
Overview
Anemia is a leading cause or risk factor for maternal deaths and adverse pregnancy outcomes, especially in developing countries.[1,2] For example, the relative risk of death from maternal complications has been estimated to be 3.5 times greater with severe anemia and 1.35 times greater with moderate anemia, compared to a woman without anemia.[3] Anemia is thus an important risk factor to include in the model.
The main causes of anemia are poor nutrition (e.g. iron and vitamin deficiencies), infectious diseases (e.g. malaria), and untreated genetic hemoglobin disorders.[2]
Anemia status is determined by hemoglobin levels, as defined by the WHO for different populations (e.g. children of different ages, pregnant women, etc). Here we present the WHO definitions for anemia among pregnant women.[4]
| Status | Hemoglobin level at sea level (g/l) |
|---|---|
| No anemia | 110 or higher |
| Mild | 100 to 109 |
| Moderate | 70 to 99 |
| Severe | Lower than 70 |
Note: While it is a common term, ‘mild’ anemia is misleading, as iron deficiency is already advanced by the time anemia is detected, which may have consequences even before anemia is clinically apparent.[4]
As residential elevation above sea level and smoking are known to increase hemoglobin concentrations, anemia definitions must be adjusted for altitude and smoking so that the prevalence is not underestimated. The WHO recommends the following adjustments[4]:
| Altitude (meters above sea level) | Measured hemoglobin adjustment (g/l) |
|---|---|
| <1000 | 0 |
| 1000 | -2 |
| 1500 | -5 |
| 2000 | -8 |
| 2500 | -13 |
| 3000 | -19 |
| 3500 | -27 |
| 4000 | -35 |
| 4500 | -45 |
| Smoking status | Measured hemoglobin adjustment (g/l) |
|---|---|
| Non-smoker | 0 |
| Smoker (all) | -3 |
| 0.5-1 packet/day | -3 |
| 1-2 packets/day | -5 |
| 2+ packets/day | -7 |
Data
In high income countries, it was estimated that 16% of women and 22% of pregnant women had anemia in 2011, with the highest rates of anemia occurring in low income countries, especially Central and West Africa (56% of pregnant women) and South Asia (52% of pregnant women).[5] Overall, it is estimated that developing countries account for 90% of the anemia burden.[1]
Modeled estimates of overall anemia prevalence among pregnant women by country were available from the WHO GHO database.[6] Estimates were available for 186 countries for 1990-2016. We supplemented these data with an analysis of individual-level hemoglobin data from pregnant women in 111 DHS surveys (n=97,613), stratified by urban/rural location and level of education. Here we plot the empirical distributions of hemoglobin estimated from DHS data.
Parameters
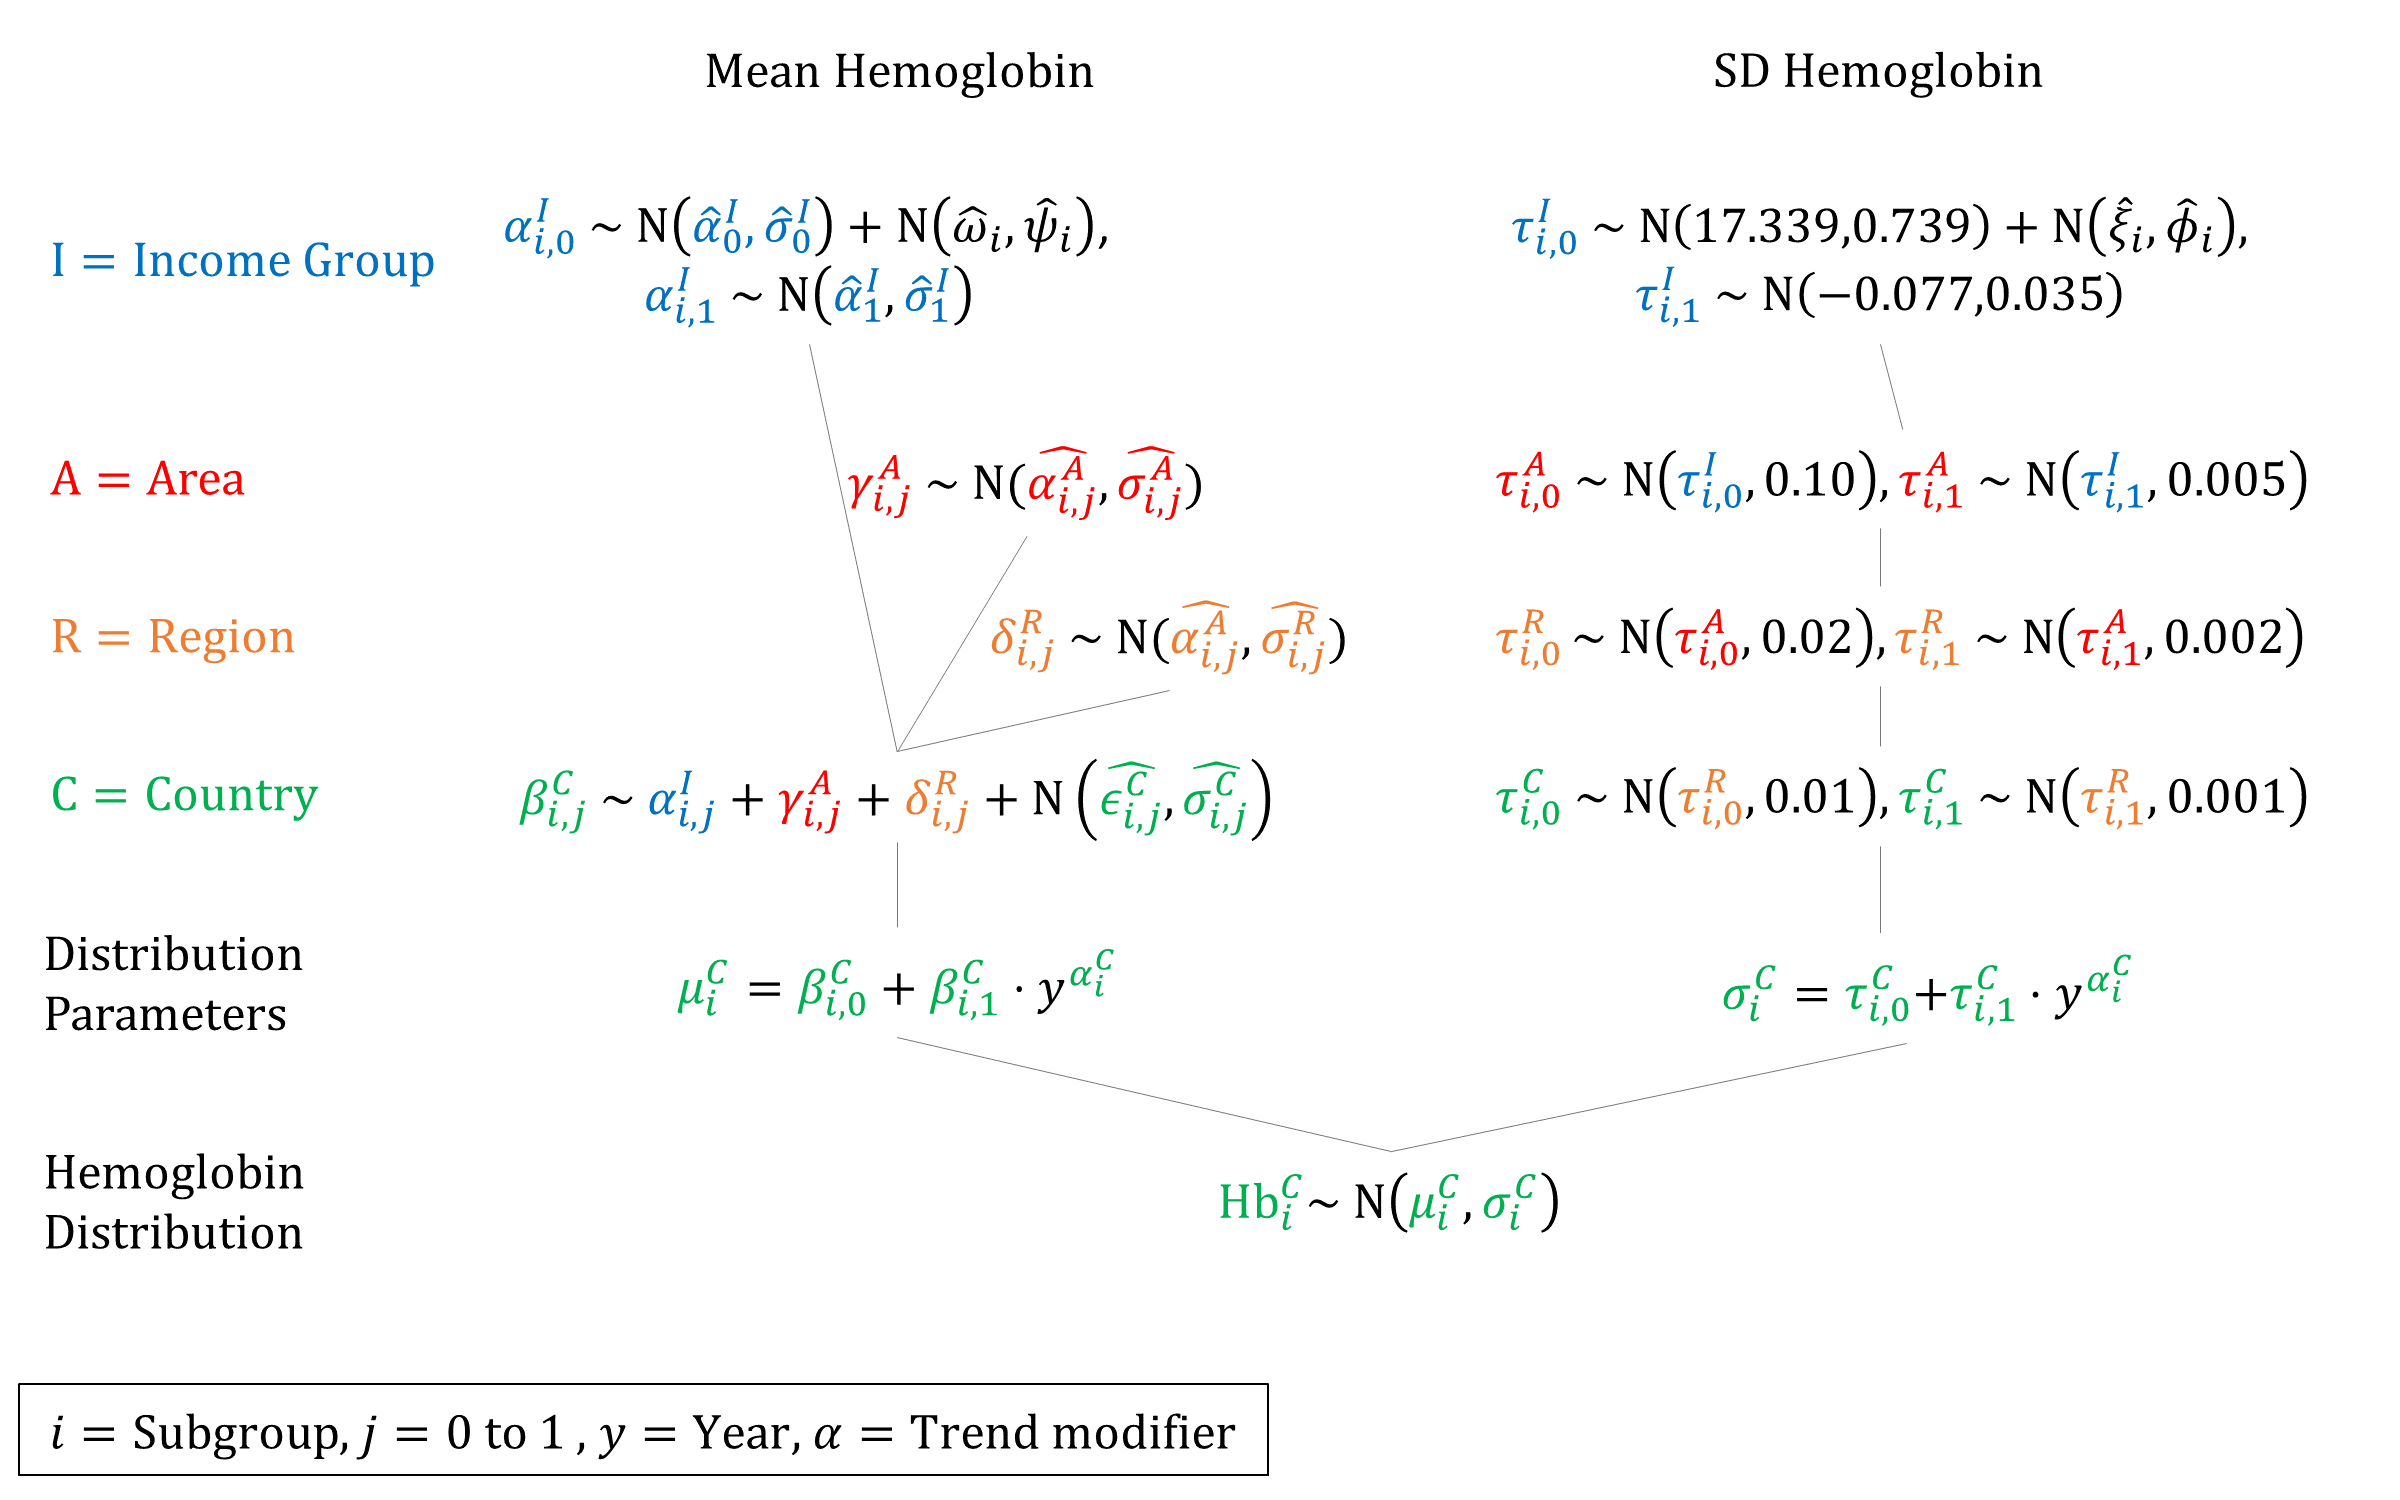
We model the underlying distribution of hemoglobin to better model the prevalence of anemia severity. We assume that hemoglobin levels are normally distributed - an assumption borne out by the empirical data (see above). While hemoglobin may be slightly skewed to the left, because we are only interested in anemia prevalence, we only need to accurately model the left side of the distribution.
Anemia is defined as hemoglobin less than 110 g/L, so we use the normal CDF to estimate underlying parameter values of \(\mu\) and \(\sigma\) for each country that give rise to the estimated anemia prevalence over time.
\[ \begin{gathered} \text{p(Anemia)}=\frac{1}{2} \left[ 1+\text{erf} \left( \frac{110-\mu}{\sigma\sqrt{2}} \right) \right] \\ 2\cdot\text{p(Anemia)}-1= \text{erf} \left( \frac{110-\mu}{\sigma\sqrt{2}} \right) \\ \text{erf}^{-1} \left( 2\cdot\text{p(Anemia)}-1 \right)= \frac{110-\mu}{\sigma\sqrt{2}} \\ \mu = 110 - \sigma\sqrt{2} \cdot \text{erf}^{-1} \left( 2\cdot\text{p(Anemia)}-1 \right) \\ \end{gathered} \]
However, because we only have 1 number (prevalence) at each timepoint, and 2 parameters to fit, we have to fix one parameter in order to estimate the other given the data. We estimated the empirical SDs of hemoglobin distribution in each DHS dataset and found they had a mean of 15.81 and SD of 1.93. We sampled a value for \(\sigma\) from this distribution and held it fixed across countries, then estimated \(\mu\) using the inverse normal CDF.
We then fit linear regressions (weighted by the inverse of the prevalence CIs) to estimate how \(\mu\) has changed over time. We repeated this 100 times to estimate a set of regression coefficients for different values of \(\sigma\). We then estimated priors for a hierarchical model based on these estimated coefficients.
To estimate SDs we fit linear regressions to DHS estimates of hemoglobin SDs over time. We bootstrapped the DHS estimates 1000 times to estimate the variance for these estimates. We used these estimates as global priors.
We estimated the empirical means and SDs of the subgroup-specific (urban/rural and education) hemoglobin distributions in DHS. Below we plot the differences of means and SDs for each subgroup compared to the country overall. These subgroup-specific offsets were used to offset the estimated overall priors by shifting the income intercept.
Priors
Model Implementation
We simulate a hemoglobin value (and thus anemia status) at the beginning of each pregnancy. We simulate a latent variable for each woman which tracks her relative position in the distribution, while the distribution itself is updated over time to reflect secular trends in anemia prevalence. We model an improvement in hemoglobin levels for women who attend antenatal care, and a decrease in hemoglobin for women who experience postpartum hemorrhage.
References
- Kassebaum NJ, GBD 2013 Anemia Collaborators. The Global Burden of Anemia. Hematol Oncol Clin North Am 2016; 30(2):247-308. DOI: https://doi.org/10.1016/j.hoc.2015.11.002
- Rahman MM, Abe SK, Rahman MS, et al. Maternal anemia and risk of adverse birth and health outcomes in low- and middle-income countries: systematic review and meta-analysis. Am J Clin Nutr 2016; 103(2): 495-504. DOI: https://doi.org/10.3945/ajcn.115.107896
- Brabin BJ, Hakimi M, Pelletier D. An analysis of anemia and pregnancy-related maternal mortality. J Nutr 2001; 131(2S-2): 604S-614S. DOI: https://doi.org/10.1093/jn/131.2.604S
- World Health Organization. Haemoglobin concentrations for the diagnosis of anaemia and assessment of severity. Geneva: World Health Organization, 2011. Available at: https://www.who.int/vmnis/indicators/haemoglobin/en/
- Stevens GA, Finucane MM, De-Regil LM, et al. Global, regional, and national trends in haemoglobin concentration and prevalence of total and severe anaemia in children and pregnant and non-pregnant women for 1995–2011: a systematic analysis of population-representative data. Lancet Glob Health 2013; 1: e16–25. DOI: https://doi.org/10.1016/S2214-109X(13)70001-9
- World Health Organization. Prevalence of anaemia in pregnant women - Estimates by country. Global Health Observatory. Last updated 2017-08-30. Available at: http://apps.who.int/gho/data/view.main.ANAEMIAWOMENPWv

GMatH (Global Maternal Health) Model - Last updated: 28 November 2022
© Copyright 2020-2022 Zachary J. Ward
zward@hsph.harvard.edu