Elective Caesarean Section
Model Inputs \(\rightarrow\) Clinical Interventions \(\rightarrow\) Elective Caesarean Section
Overview
Caesarean section (c-section) use has increased during the past few decades to a level often in excess of the 10-15% of deliveries for which it is though to be optimal, driven by major increases in non-medically indicated c-sections in many middle-income and high-income countries.[1] In contrast, many low-income and middle-income countries have c-section rates of less than 10%, which is considered to reflect inadequate access to medically indicated procedures.[1] In addition, large differences in c-section use have been observed between the poorest and richest women within many countries,[1] with many women in private facilities choosing to deliver by c-section without indications of complication.[2] It is estimated that the global increase in c-section use between 2000 and 2015 was driven mainly by an increasing proportion of births taking place in health facilities (accounting for 66% of the increase), while an increase in c-section use within health facilities accounted for an estimated 33% of the increase.[1]
Although c-section can be a live-saving intervention for mothers and children, it can result in short-term and long-term health consequences.[3] The risk of postpartum infection is especially high for c-section.[4] While elective c-section is less risky than non-elective c-section,[5,6] there is nevertheless a higher risk of infection after a c-section than after a spontaneous vaginal delivery.[4]
Data
We obtained data on national c-section rates by country from the UNICEF Maternal and Newborn Health Coverage Database.[7] 548 estimates were available for 166 countries included in the model between 1990 to 2020. Estimates ranged from 0% in Chad to over 50% in countries such as Venezuela, Brazil, and the Dominican Republic. Here we plot the national UNICEF estimates by income group.
To examine trends within countries we supplemented the UNICEF data with analysis of DHS data for 1,642,046 women from 252 datasets in 75 countries. Here we plot the estimated c-section rates by subgroup (urban/rural and level of education) and year.
To estimate priors by subgroup we imputed subgroup-specific estimates from the national UNICEF data for countries not available in the DHS data. Note that these estimates of c-section rates include both elective and emergency c-sections. We therefore rely on calibration to total c-section rates (elective and emergency) in the model to fit probabilities of elective c-section, which are expected to be lower than the estimated priors (see calibration targets).
Parameters
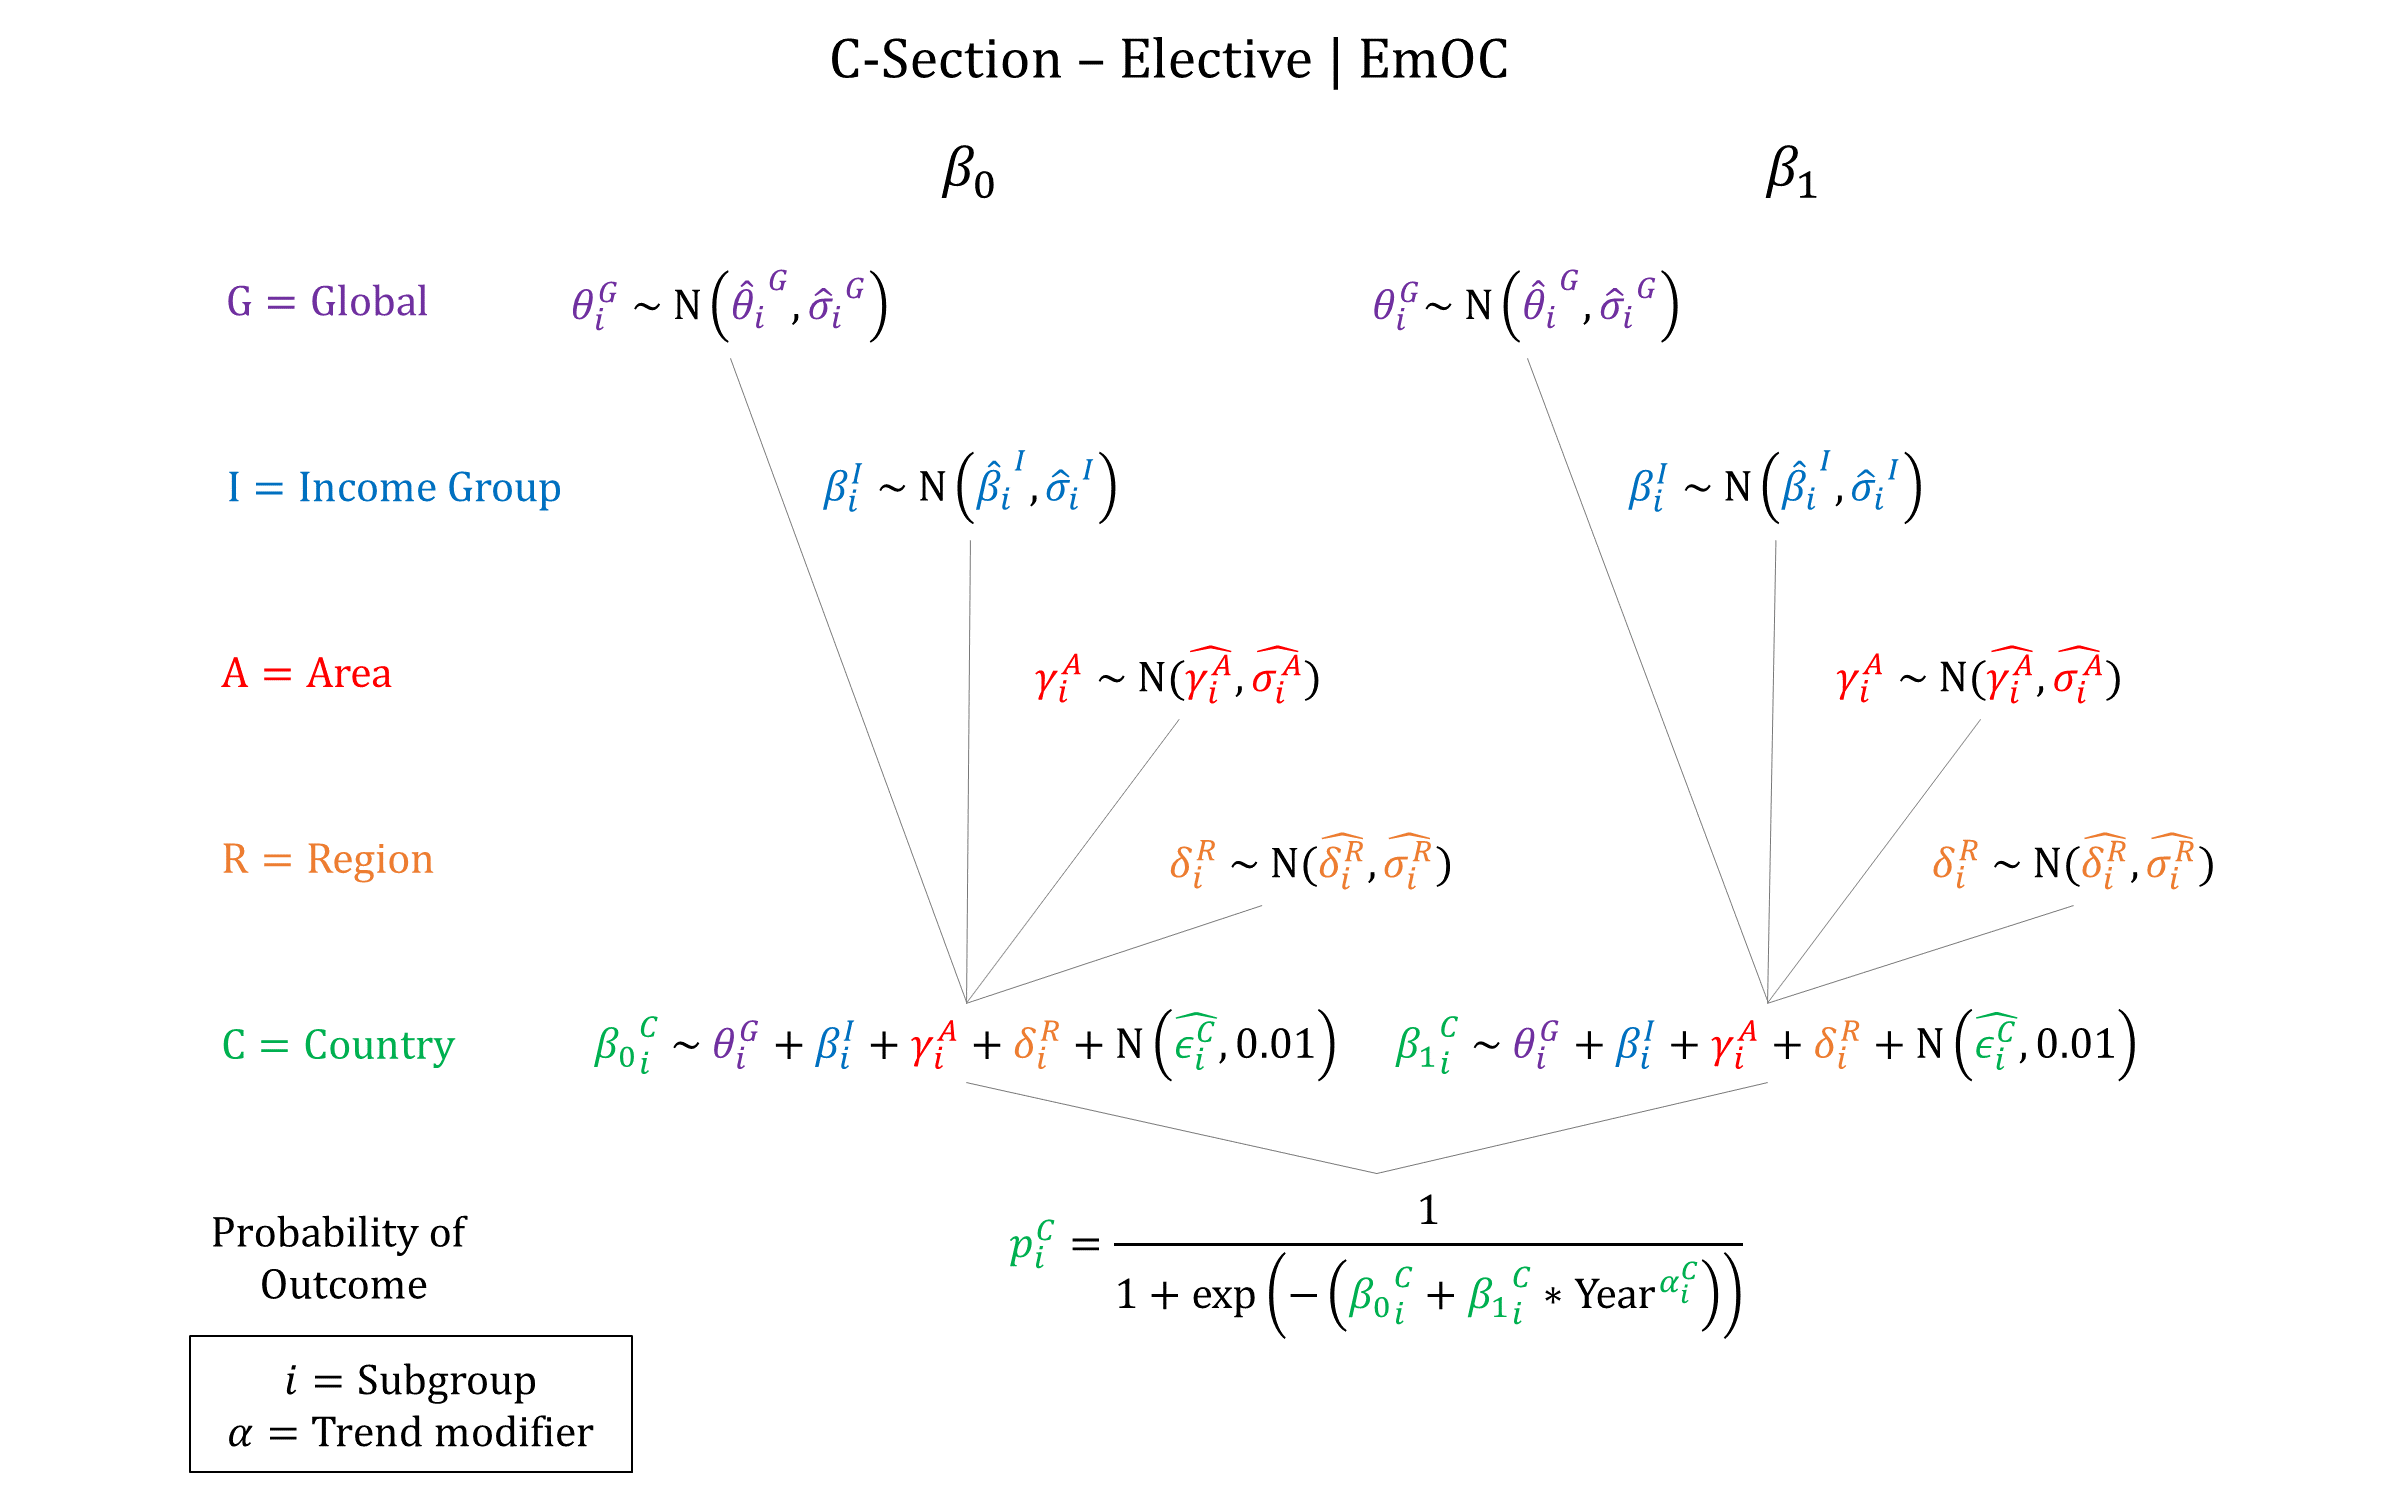
We used a hierarchical logistic regression model to simulate the probability of elective c-section. We assume that elective c-section is only available in EmOC facilities.

Priors
Model Implementation
At the time of delivery we simulate the probability of elective c-section for women in EmOC facilities. For simplicity, we assume that woman who undergo elective c-section are not at risk for preeclampsia/eclampsia, obstructed labour, or postpartum hemorrhage. We do model an increased risk of sepsis however, and also model the risk of other direct complications.
References
- Boerma T, Ronsmans C, Melesse DY, et al. Global epidemiology of use of and disparities in caesarean sections. Lancet 2018; 392(10155): 1341-1348. DOI: https://doi.org/10.1016/s0140-6736(18)31928-7
- Ronsmans C, Holtz S, Stanton C. Socioeconomic differentials in caesarean rates in developing countries: A retrospective analysis. Lancet 2006; 368(9546): 1516-1523. DOI: https://doi.org/10.1016/s0140-6736(06)69639-6
- Sandall J, Tribe RM, Avery L, et al. Short-term and long-term effects of caesarean section on the health of women and children. Lancet 2018; 392(10155): 1349-1357. DOI: https://doi.org/10.1016/s0140-6736(18)31930-5
- Buddeberg BS, Aveling W. Puerperal sepsis in the 21st century: progress, new challenges and the situation worldwide. Postgrad Med J 2015; 91(1080): 572-8. DOI: https://doi.org/10.1136/postgradmedj-2015-133475
- American College of Obstetricians and Gynecologists. ACOG Practice Bulletin No. 120: Use of prophylactic antibiotics in labor and delivery. Obstet Gynecol 2011; 117(6): 1472-83. DOI: https://doi.org/10.1097/aog.0b013e3182238c31
- Smaill F, Hofmyer GJ. Antibiotic prophylaxis for caesarean section. Cochrane Database Syst Rev 2002; 3: CD000933. DOI: https://doi.org/10.1002/14651858.cd000933
- UNICEF. Maternal and Newborn Health Coverage Database, August 2020. Available at: https://data.unicef.org/topic/maternal-health/delivery-care/
GMatH (Global Maternal Health) Model - Last updated: 28 November 2022
© Copyright 2020-2022 Zachary J. Ward
zward@hsph.harvard.edu