
Miscarriage
Model Inputs \(\rightarrow\) Biological Parameters \(\rightarrow\) Miscarriage
Overview
The term ‘miscarriage’ in the model refers to spontaneous abortion. Ectopic pregnancy is modeled separately as a high risk condition with risks of morbidity/mortality. In contrast, we assume that spontaneous abortion poses no physical risks to the mother.
Data
Maternal age is a strong predictor of miscarriage. Andersen (2000)[1] presents rates of spontaneous abortion by maternal age group from a population-based register linkage study in Denmark. After adjusting the denominator by subtracting all induced abortions from the number of pregnancies, the adjusted risk of miscarriage was calculated by age group. These estimates are thus conditional on no induced abortion.
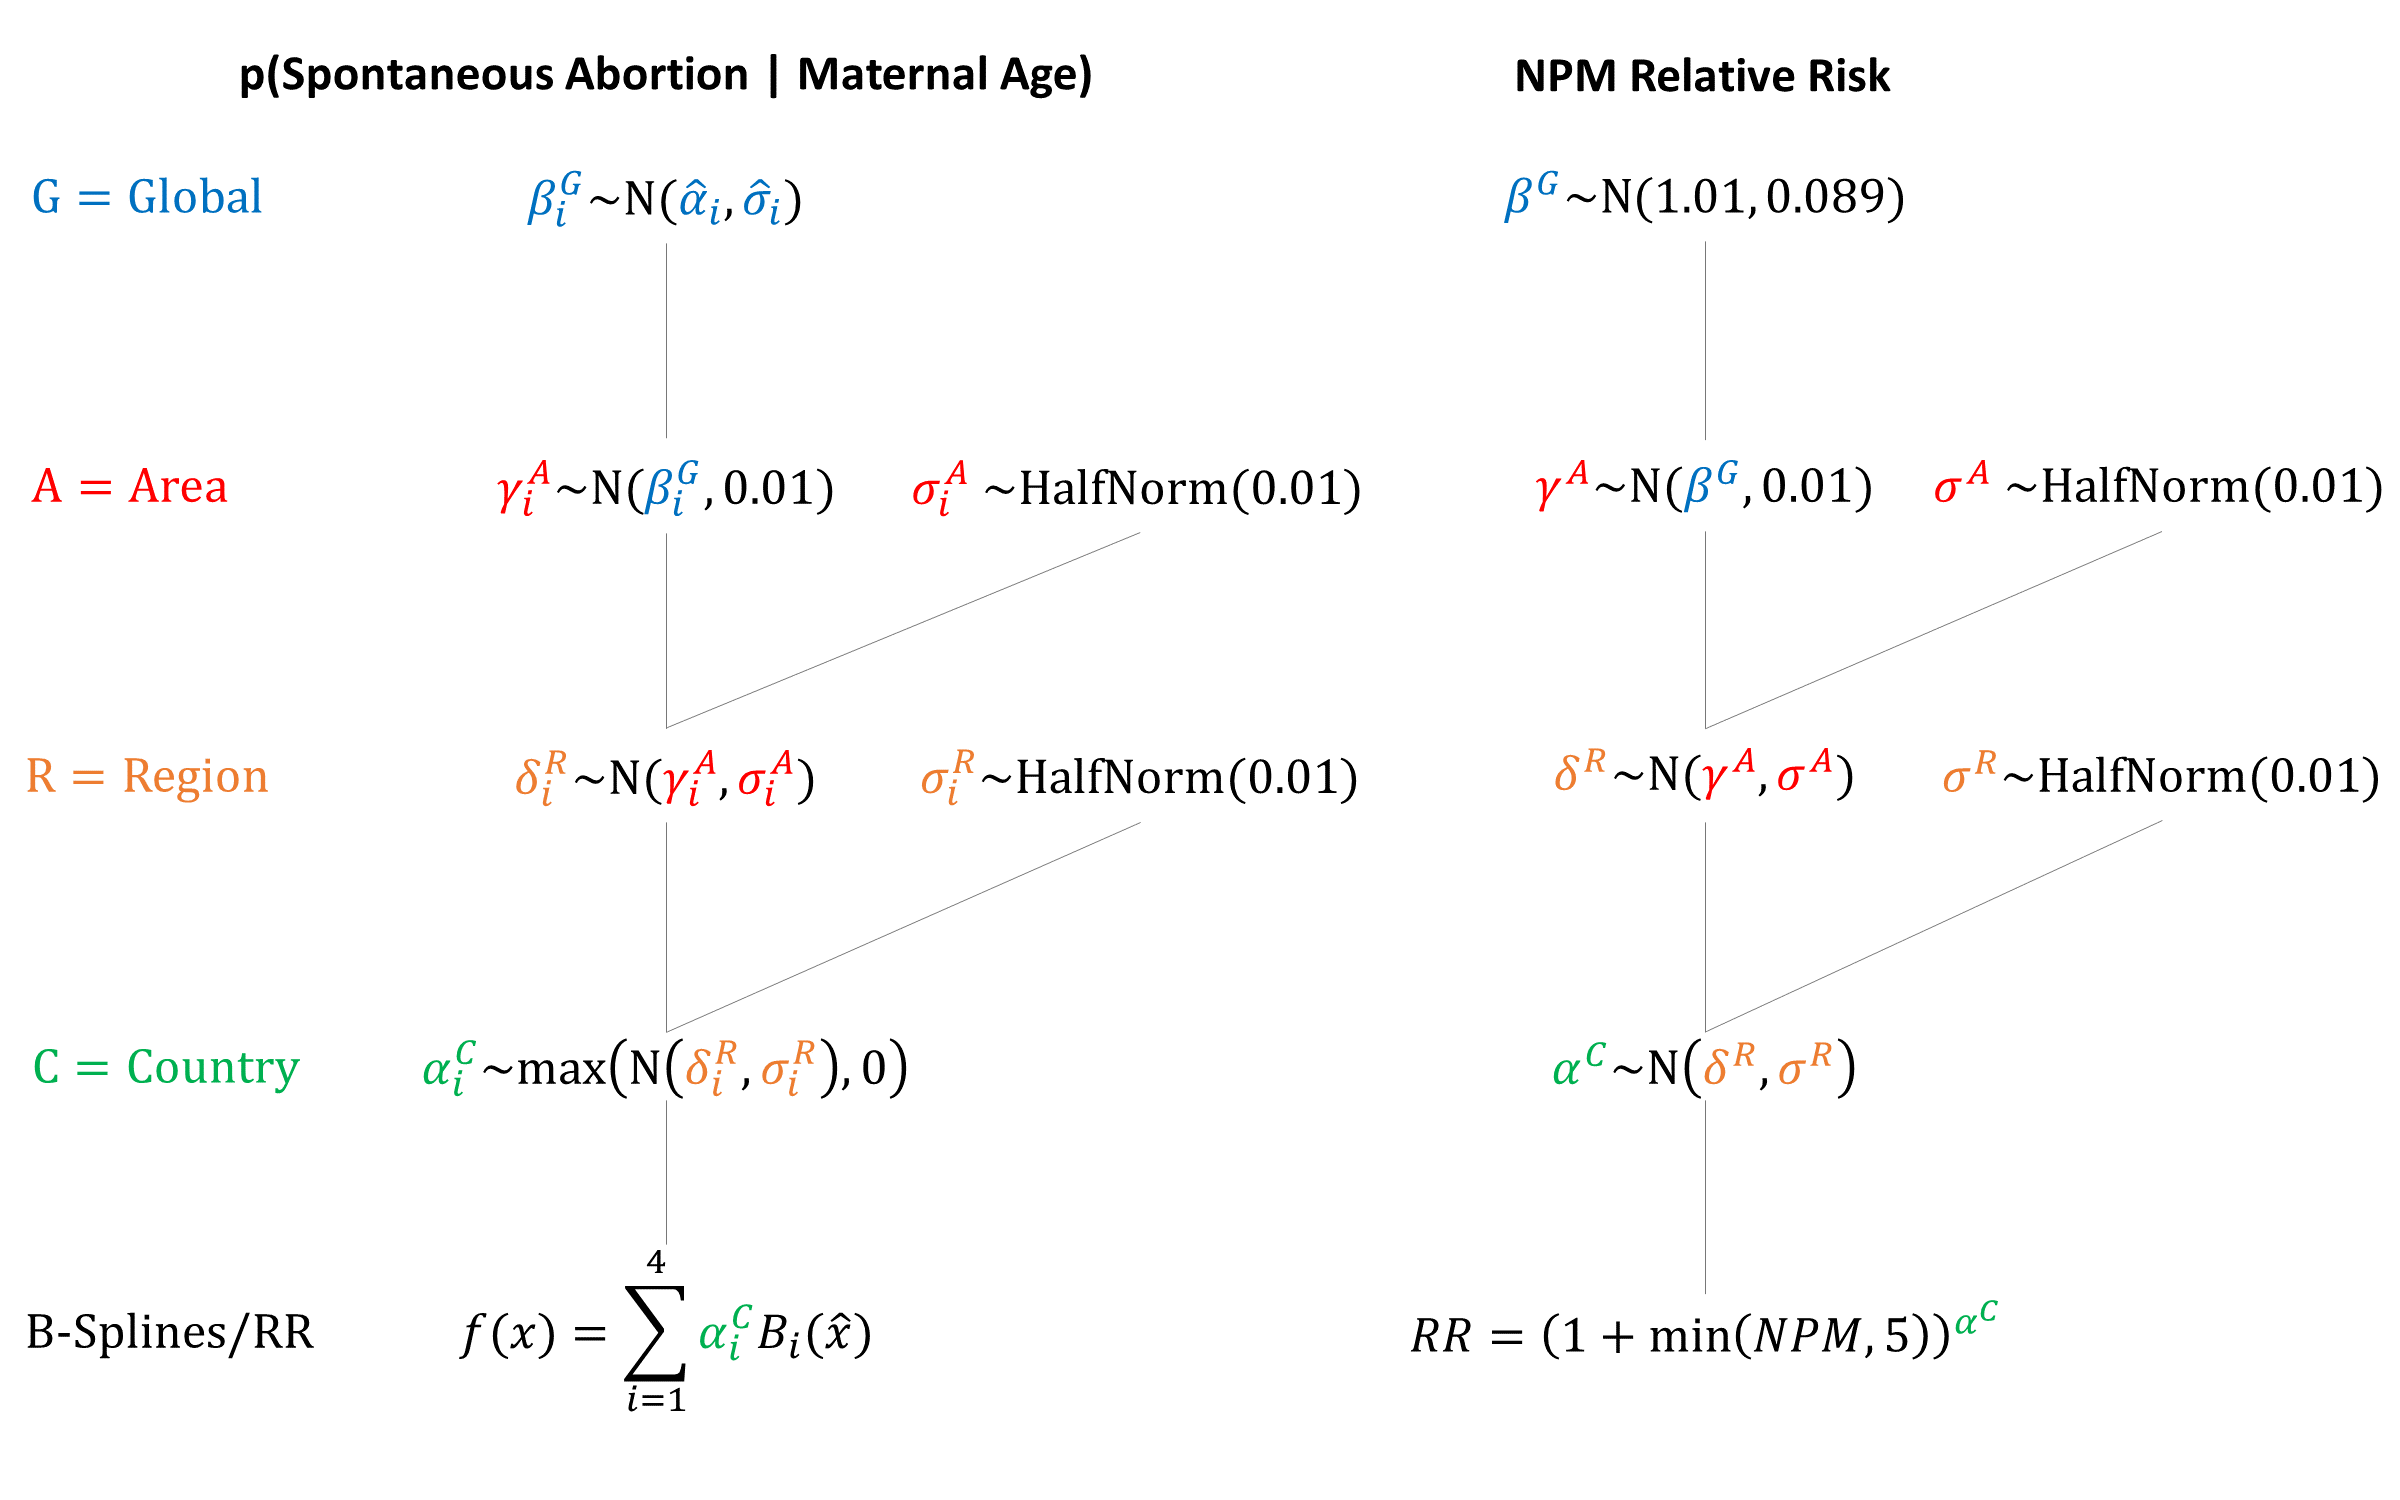
The risk of miscarriage given previous miscarriages is also modeled, to take into account within-women clustering/high-risk women. Estimates were modeled using data from Risch 1988,[2] which estimated a Relative Risk of miscarriage based on the number of previous miscarriages (\(NPM\)). The equation is: \((1+NPM)^{\alpha}\), where \(\alpha\) was estimated to be 1.01 (95% CI 0.83-1.18). Some of the estimated increased risk is likely due to older age, so we use calibration to estimate the overall risk of miscarriage, taking into account maternal age and previous number of miscarriages.
A systematic review by Avalos et al. (2012)[3] reported risk of miscarriage by gestational age up to 20 weeks gestation. The distribution of gestational age at miscarriage across the 4 sources[4,5,6,7] was averaged in order to estimate the distribution of gestational ages at which miscarriages occur. All miscarriages are assumed to occur by 6 months gestation. The midpoint (in weeks) of month of gestation was used and the following distribution is assumed in the model:
| Month of Gestation | Cumulative Probability of Miscarriage | Miscarriage |
|---|---|
| 2 | 0.2262 |
| 3 | 0.5866 |
| 4 | 0.8824 |
| 5 | 0.9684 |
| 6 | 1.0 |
Estimates of miscarriage in early pregnancy are especially difficult to ascertain as women may not know that they are pregnant. We therefore begin modeling the risk of miscarriage in the second month of gestation.
Parameters
We fit quadratic B-splines to the midpoints of the age groups. Spline Width: 40
| Spline # | Knot Location | Height |
|---|---|---|
| 1 | 8 | \(N(0.15,0.02)\) |
| 2 | 22 \(^1/_3\) | \(N(0.09,0.02)\) |
| 3 | 37 \(^1/_3\) | \(N(0.14,0.02)\) |
| 4 | 52 | \(N(1.15,0.08)\) |
We used the estimated probability of miscarriage at age 50 for older ages.
To model increased risk given a history of miscarriage, we base our prior on Risch 1988,[2] which estimated \(\alpha\) to be 1.01 (95% CI 0.83-1.18), which translates to \(\alpha \sim N(1.01, 0.089)\). A maximum of 5 previous miscarriages is used when estimating increased risks of miscarriage.
Priors
Model Implementation
Following conception in the model, the risk of miscarriage is simulated based on a woman’s age and her history of previous miscarriages. If a miscarriage is simulated to happen, the gestational age at which it occurs is drawn from the distribution of months of gestation. We assume that there is no risk of maternal morbidity or mortality from miscarriage.
References
- Andersen AM, Wohlfahrt J, Christens P, Olsen J, Melbye M. Maternal age and fetal loss: population based register linkage study. BMJ 2000; 320(7251): 1708-12. DOI: https://doi.org/10.1136/bmj.320.7251.1708
- Risch HA, Weiss NS, Clarke EA, Miller AB. Risk factors for spontaneous abortion and its recurrence. Am J Epidemiol. 1988; 128(2): 420-30. DOI: https://doi.org/10.1093/oxfordjournals.aje.a114982
- Avalos LA, Galindo C, Li DK. A systematic review to calculate background miscarriage rates using life table analysis. Birth Defects Res A Clin Mol Teratol 2012; 94(6): 417-432. DOI: https://doi.org/10.1002/bdra.23014
- Taylor WF. The probability of fetal death. In: Fraser FC, McKusick VA, editors. Congenital malformations: proceedings of the Third International Conference, The Hague, The Netherlands, Sept 7-13, 1969. 2nd ed. Amsterdam: Excepta Medica, 1970.
- Harlap S, Shiono PH, Ramcharan S. A life table of spontaneous abortions and the effects of age, parity and other variables. In: Porter IH, Hook EB, editors. Human Embryonic and Fetal Death. New York: Academic Press, 1980.
- Goldhaber MK, Fireman BH. The fetal life table revisited: spontaneous abortion rates in three Kaiser Permanente cohorts. Epidemiology 1991; 2(1): 33-39. PMID: https://www.ncbi.nlm.nih.gov/pubmed/2021664
- Li DK, Odouli R, Wi S, et al. A population-based prospective cohort study of personal exposure to magnetic fields during pregnancy and the risk of miscarriage. Epidemiology 2002; 13(1): 9-20. DOI: https://doi.org/10.1097/00001648-200201000-00004

GMatH (Global Maternal Health) Model - Last updated: 28 November 2022
© Copyright 2020-2022 Zachary J. Ward
zward@hsph.harvard.edu