
Twinning Rates
Model Inputs \(\rightarrow\) Biological Parameters \(\rightarrow\) Twinning Rates
Overview
Twins are simulated in the model to more accurately represent the number of births in the population, and to account for increased risks of delivery complications that may occur with multiple fetuses. We do not model triplets or higher order multiples due to their very low incidence.[1]
Data
Monozygotic twinning is thought to occur at a relatively constant rate of 3.5–4 per 1000 births across human populations.[2,3] However, the rate of dizygotic twinning varies greatly around the world, leading to large differences in overall twinning rates, which range from about 6 per 1000 births in Asia, to 10-20 per 1000 births in Europe and the USA, to about 40 per 1000 births in parts of Africa.[2]
A study based on 150 Demographic and Health Surveys, conducted between 1987 and 2010 in 75 low and middle income countries found similar differences in twinning rates, with variation caused by dizygotic twinning rates.[3] In developed countries, twinning rates have been increasing.[4] A study of trends in the US found that only about 1/3 of the increase was due to increasing maternal age, with the rest likely explained by increased use of infertility treatments.[5]
The number of twin pregnancies increases substantially with maternal age,[3,6] with estimated twinning rates increasing more than 4-fold between the ages 15 and 37 years with parity held constant.[7,8]
Several studies have reported twinning rates (per 1,000) by maternal age:
| Maternal Age | Monozygotic | Dizygotic | Country | Source |
|---|---|---|---|---|
| <20 | 5.4 | 3.6 | Israel | Harlap 1979[9] |
| 20-24 | 5.1 | 5.8 | ||
| 25-29 | 5.0 | 11.3 | ||
| 30-34 | 5.1 | 8.3 | ||
| 35-39 | 7.3 | 17.3 | ||
| \(\geq\) 40 | 7.4 | — | ||
| \(\leq\) 29 | 4.2 | 32.3 | Nigeria | Nylander 1981[10] |
| \(\geq\) 30 | 4.7 | 72.8 | ||
| <25 | 3.7 | 1.9 | India | Rao 1983[11] |
| 25-29 | 4.6 | 5.9 | ||
| 30-34 | 1.1 | 10.7 | ||
| \(\geq\) 35 | 1.0 | 12.0 | ||
| <19 | 3.6 | 2.5 | Italy | Parazzini 1991[12] |
| 20-24 | 3.6 | 4.2 | ||
| 25-29 | 4.2 | 5.4 | ||
| 30-34 | 4.1 | 7.3 | ||
| 35-39 | 4.5 | 8.1 | ||
| 40-44 | 3.8 | 6.0 | ||
| \(\geq\) 45 | 4.7 | — | ||
| <20 | 0.0 | 2.26 | India | Satija 2008[13] |
| 20-24 | 3.98 | 3.98 | ||
| 25-29 | 3.19 | 11.46 | ||
| 30-34 | 2.51 | 20.1 | ||
| <15 | 3.2 | 0.3 | Brazil | Otta 2016[14] |
| 15-19 | 3.6 | 2.1 | ||
| 20-24 | 3.9 | 4.2 | ||
| 25-29 | 4.7 | 6.6 | ||
| 30-34 | 4.9 | 10.1 | ||
| 35-39 | 5.0 | 13.0 | ||
| 40-44 | 4.2 | 12.5 | ||
| 45+ | 9.1 | 35.1 |
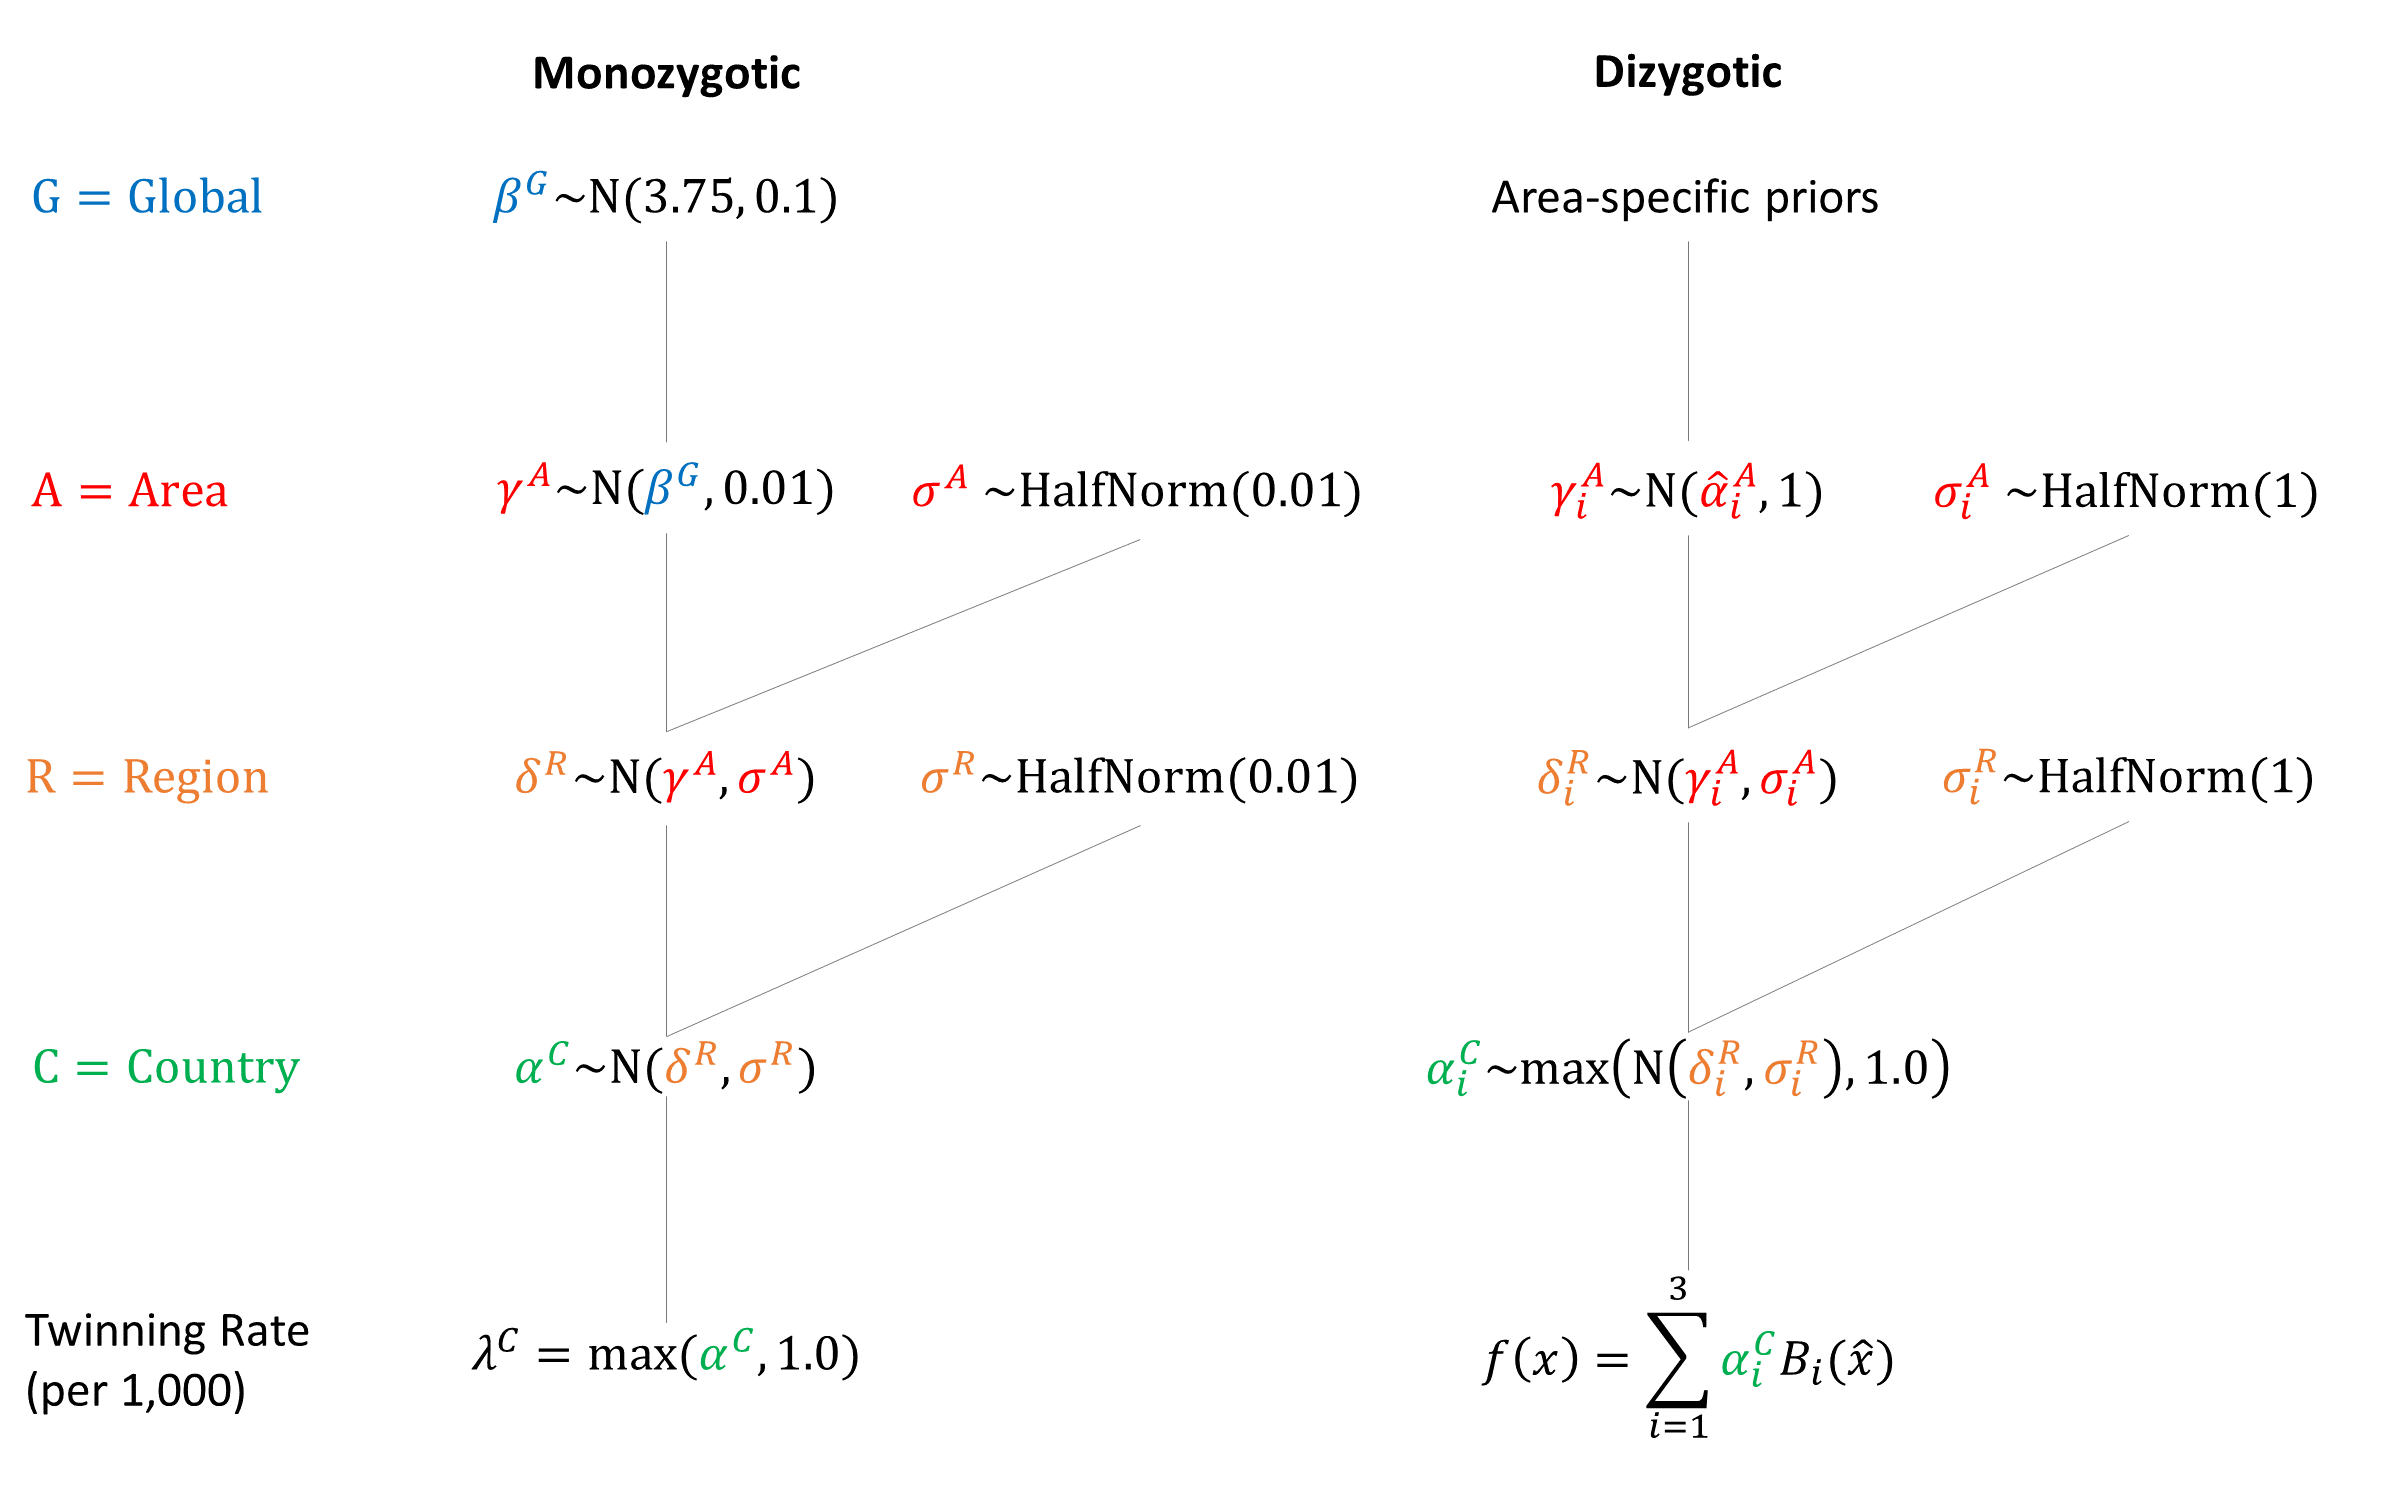
Parameters
We assumed that monozygotic twin rates are constant by maternal age. To model age-related dizygotic rates we used quadratic B-splines fit to the midpoint of the maternal age groups. The estimated dizygotic twinning rate at age 38 was used as the value for later maternal ages.
We set area-specific dizygotic priors for ‘low’ and ‘high’ twinning countries.
Spline Width: 30
| Spline # | Knot Location | Africa | Asia | Europe | Latin America | North America | Oceania |
|---|---|---|---|---|---|---|---|
| 1 | 20 | \(N(10,5)\) | \(N(2.5,1)\) | \(N(10,5)\) | \(N(2.5,1)\) | \(N(10,5)\) | \(N(10,5)\) |
| 2 | 30 | \(N(25,5)\) | \(N(10,3)\) | \(N(25,5)\) | \(N(10,3)\) | \(N(25,5)\) | \(N(25,5)\) |
| 3 | 40 | \(N(40,5)\) | \(N(20,3)\) | \(N(40,5)\) | \(N(20,3)\) | \(N(40,5)\) | \(N(40,5)\) |
Priors
Model Implementation
At conception, the model simulates whether the pregnancy is a singleton or twins. If monozygotic twins are simulated, then a single sex is simulated based on the sex ratio and applied to both fetuses. If dizygotic twins are simulated then a sex is simulated for each fetus. We assume that sex-selective abortion does not apply to twins. Country-specific twinning rate estimates are included as calibration targets to help fit the model.
References
- Fellman F, Eriksson AW. Statistical analyses of Hellin’s law. Twin Res Hum Genet 2009; 12(2): 191-200. DOI: https://doi.org/10.1375/twin.12.2.191
- Hall JG. Twinning. Lancet 2003; 362: 735–43. DOI: https://doi.org/10.1016/S0140-6736(03)14237-7
- Smits J, Monden C. Twinning across the Developing World. PLoS One 2011; 6(9): e25239. DOI: https://doi.org/10.1371/journal.pone.0025239
- Pison G, Monden C, Smits J. Twinning Rates in Developed Countries: Trends and Explanations. Popul Dev Rev 2015; 41(4): 629-649. DOI: https://doi.org/10.1111/j.1728-4457.2015.00088.x
- Martin JA, Hamilton BE, Osterman MJK. Three Decades of Twin Births in the United States, 1980-2009. NCHS Data Brief 2012, No. 80. Available at: https://www.cdc.gov/nchs/data/databriefs/db80.pdf
- Hoekstra C, Zhao ZZ, Lambalk CB, et al. Dizygotic twinning. Hum Reprod Update 2008; 14(1): 37-47. DOI: https://doi.org/10.1093/humupd/dmm036
- Bulmer MG. The Biology of Twinning in Man. Oxford: Clarendon Press, 1970. DOI: https://doi.org/10.1002/tera.1420040214
- Bortolus R, Parazzini F, Chatenoud L, Benzi G, Bianchi MM, Marini A. The epidemiology of multiple births. Hum Reprod Update 1999; 5(2): 179-187. DOI: https://doi.org/10.1093/humupd/5.2.179
- Harlap S. Multiple births in former oral contraceptive users. Br J Obstet Gynaecol 1979; 86(7): 557-62. DOI: https://doi.org/10.1111/j.1471-0528.1979.tb10809.x
- Nylander PPS. Causes of high twinning frequencies in Nigeria. In: Nance WE, Allen G, Parisi P (eds). Twin Research. Part B: Biology and Epidemiology. New York: Alan R. Liss, 1978.
- Rao PS, Inbaraj SG, Muthurathnam S. Twinning rates in Tamilnadu. J Epidemiol Community Health 1983; 37(2): 117-20. DOI: https://doi.org/10.1136/jech.37.2.117
- Parazzini F, Tozzi L, Mezzanotte G, et al. Trends in multiple births in Italy: 1955-1983. Br J Obstet Gynaecol 1991; 98(6): 535-9. DOI: https://doi.org/10.1111/j.1471-0528.1991.tb10366.x
- Satija M, Sharma S, Soni RK, Sachar RK, Singh GP. Twinning and its correlates: community-based study in a rural area of India. Hum Biol 2008; 80(6): 611-621. DOI: https://doi.org/10.3378/1534-6617-80.6.611
- Otta E, Fernandes ES, Acquaviva TG, et al. Twinning and Multiple Birth Rates According to Maternal Age in the City of São Paulo, Brazil: 2003-2014. Twin Res Hum Genet 2016; 19(6): 679-686. DOI: https://doi.org/10.1017/thg.2016.75

GMatH (Global Maternal Health) Model - Last updated: 28 November 2022
© Copyright 2020-2022 Zachary J. Ward
zward@hsph.harvard.edu