Abortion
Model Inputs \(\rightarrow\) Family Planning Parameters \(\rightarrow\) Abortion
Overview
Induced abortion is usually classified as either ‘safe’ (eg: medical abortion with misoprostol) or ‘unsafe’ (eg: traditional methods). While medical abortions still pose some level of health risk to the mother, unsafe abortion has a much higher risk of maternal mortality/morbidity, depending on the quality of the facilities and skill of the abortion provider, the intervention method used, and the general health of the mother and stage of her pregnancy.[1] Unsafe abortion may be induced by the woman herself, a nonmedical person under unhygienic conditions, or by a health worker outside of the prescribed facilities.[1] The outcome of unsafe abortion also depends on a woman’s willingness to turn to medical services in the event of a complication, and the readiness of medical staff to deal promptly with the complications.[1] Deaths due to unsafe abortion are mainly caused by bleeding or severe infections caused by the abortion procedure, or due to organ damage. Women may also suffer long-term health consequences such as infertility, as well as shorter-term effects.[1]
Data
Incidence
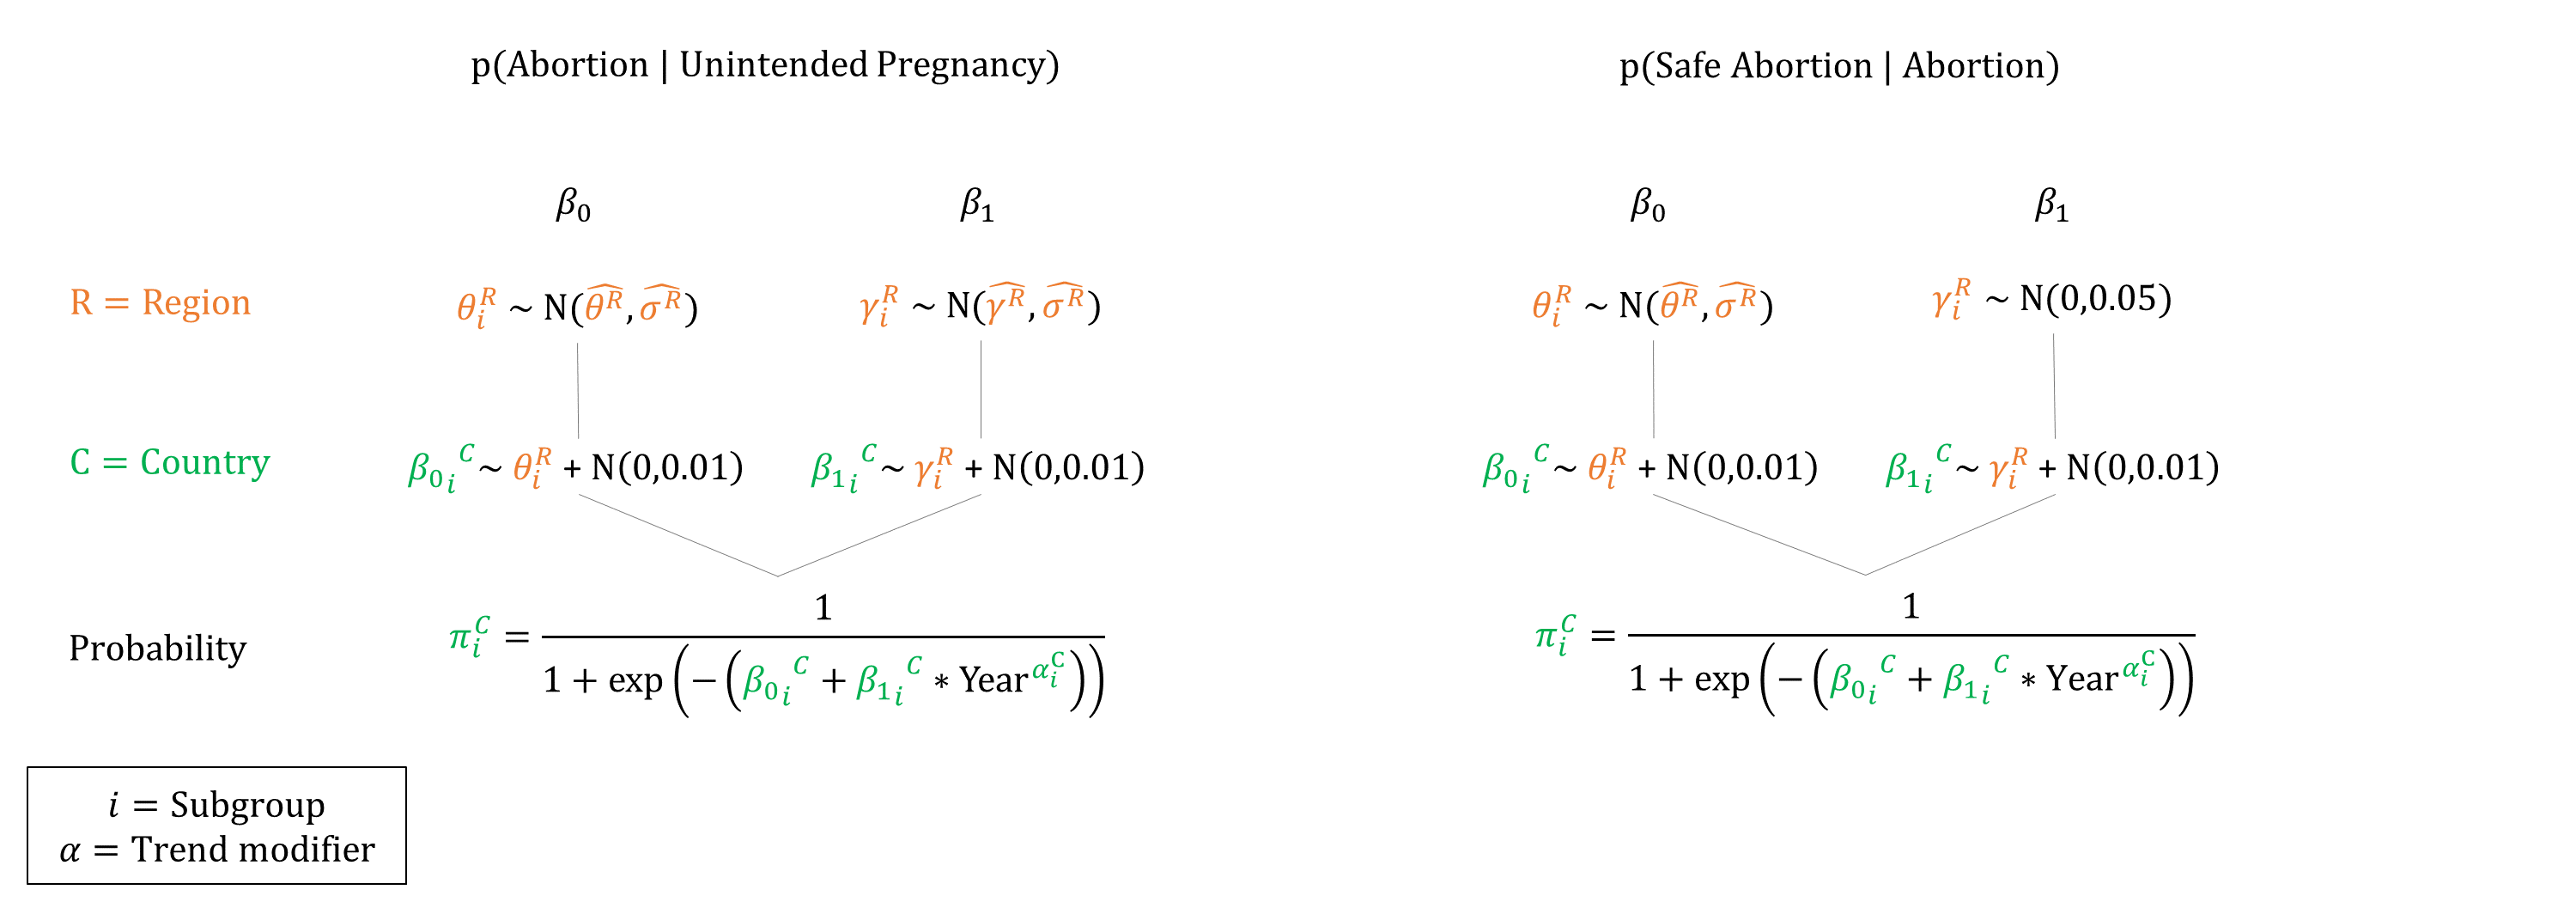
To estimate the probability of abortion given unintended pregnancy we use estimates from a global model of unintended pregnancy and its outcomes.[2] Here we plot estimates of the proportion of unintended pregnancies which end in abortion by region over time.
To estimate the proportion of abortions that are ‘safe’ we used regional estimates from a model of global abortions.[3]
Mortality
Estimates of abortion mortality vary by location. Estimates of abortion-related mortality in the US in 2000-2009 find a rate of 0.7 per 100,000 abortions.[4,5] A study in India found that out of 89,194 abortions in 2012-2013, there were 253 maternal deaths, with 67% of abortions classified as ‘unsafe’, indicating an overall CFR of 0.3%.[6] A study in Zimbabwe of 1002 women presenting with abortion complications found that 0.2% died, with 19% presenting with ‘severe’ complications, and 3% with ‘near miss’ complications. [7] A study in Kinshasa of women who were admitted to receive obstetric and gynecological emergency care services in 2014, the mortality rate related to induced abortion was 5.6% (95% CI: 2.3–11.3%).[8] A systematic review of 70 studies from 28 countries between 1988 and 2014 found that at least 9% of abortion-related hospital admissions have a near-miss event and approximately 1.5% end in death, with hemorrhage the most common complication reported.[9] The WHO estimates that the global case-fatality rate associated with unsafe abortion (220 per 100,000) is 350 times higher than the rate associated with legal induced abortions in the US, with rates more than 800 times higher in sub-Saharan Africa - even in developed countries, the case-fatality rate for unsafe abortion is 40 times higher than for legal induced abortion.[1] Here we report the WHO estimates of unsafe abortion CFRs by region (adapted from Table 7, WHO 2011)[1]:
| Region | Estimated number of deaths per 100,000 unsafe abortions |
|---|---|
| WORLD | 220 |
| Developed regions | 30 |
| Developing regions | 220 |
| AFRICA | 460 |
| Eastern Africa | 520 |
| Middle Africa | 470 |
| Northern Africa | 170 |
| Southern Africa | 370 |
| Western Africa | 540 |
| ASIA | 160 |
| South-Central Asia | 200 |
| South-Eastern Asia | 70 |
| Western Asia | 70 |
| EUROPE | 30 |
| Eastern Europe | 30 |
| LATIN AMERICA AND THE CARIBBEAN | 30 |
| Caribbean | 80 |
| Central America | 20 |
| South America | 20 |
| OCEANIA | 400 |
Morbidity
A nationwide register study of induced abortion in Finland (which we assume are virtually all ‘safe’) found that the proportion of women with IVF treatment after induced abortion in the whole cohort was 0.4%.[10] Factors associated with induced abortion such as gestational age at abortion, method of abortion, and complications following abortion were not associated with the use of IVF treatment later. The WHO estimates that 20-30% of unsafe abortions result in reproductive tract infections, of which 20-40% result in upper-genital-tract infection and infertility.[11] Global Burden of Disease (2000) estimates of the probability of secondary infertility from unsafe abortion ranged from 3% to 12% by region.[12]
Parameters
We based our priors for abortion incidence on estimates by Bearak 2020.[2] To estimate priors we simulated data by drawing samples from the reported posteriors. We drew 100 points for each time period and fit logistic regressions to the simulated data for each region, using the estimated coefficients and standard errors as priors. To estimate priors for the proportion of abortions that are ‘safe’, we logit transformed the Ganatra 2017 estimates.[3] Because estimates were only available for the period 2010-14 we also set a prior for a ‘year’ coefficient to allow for time trends in safe abortion.
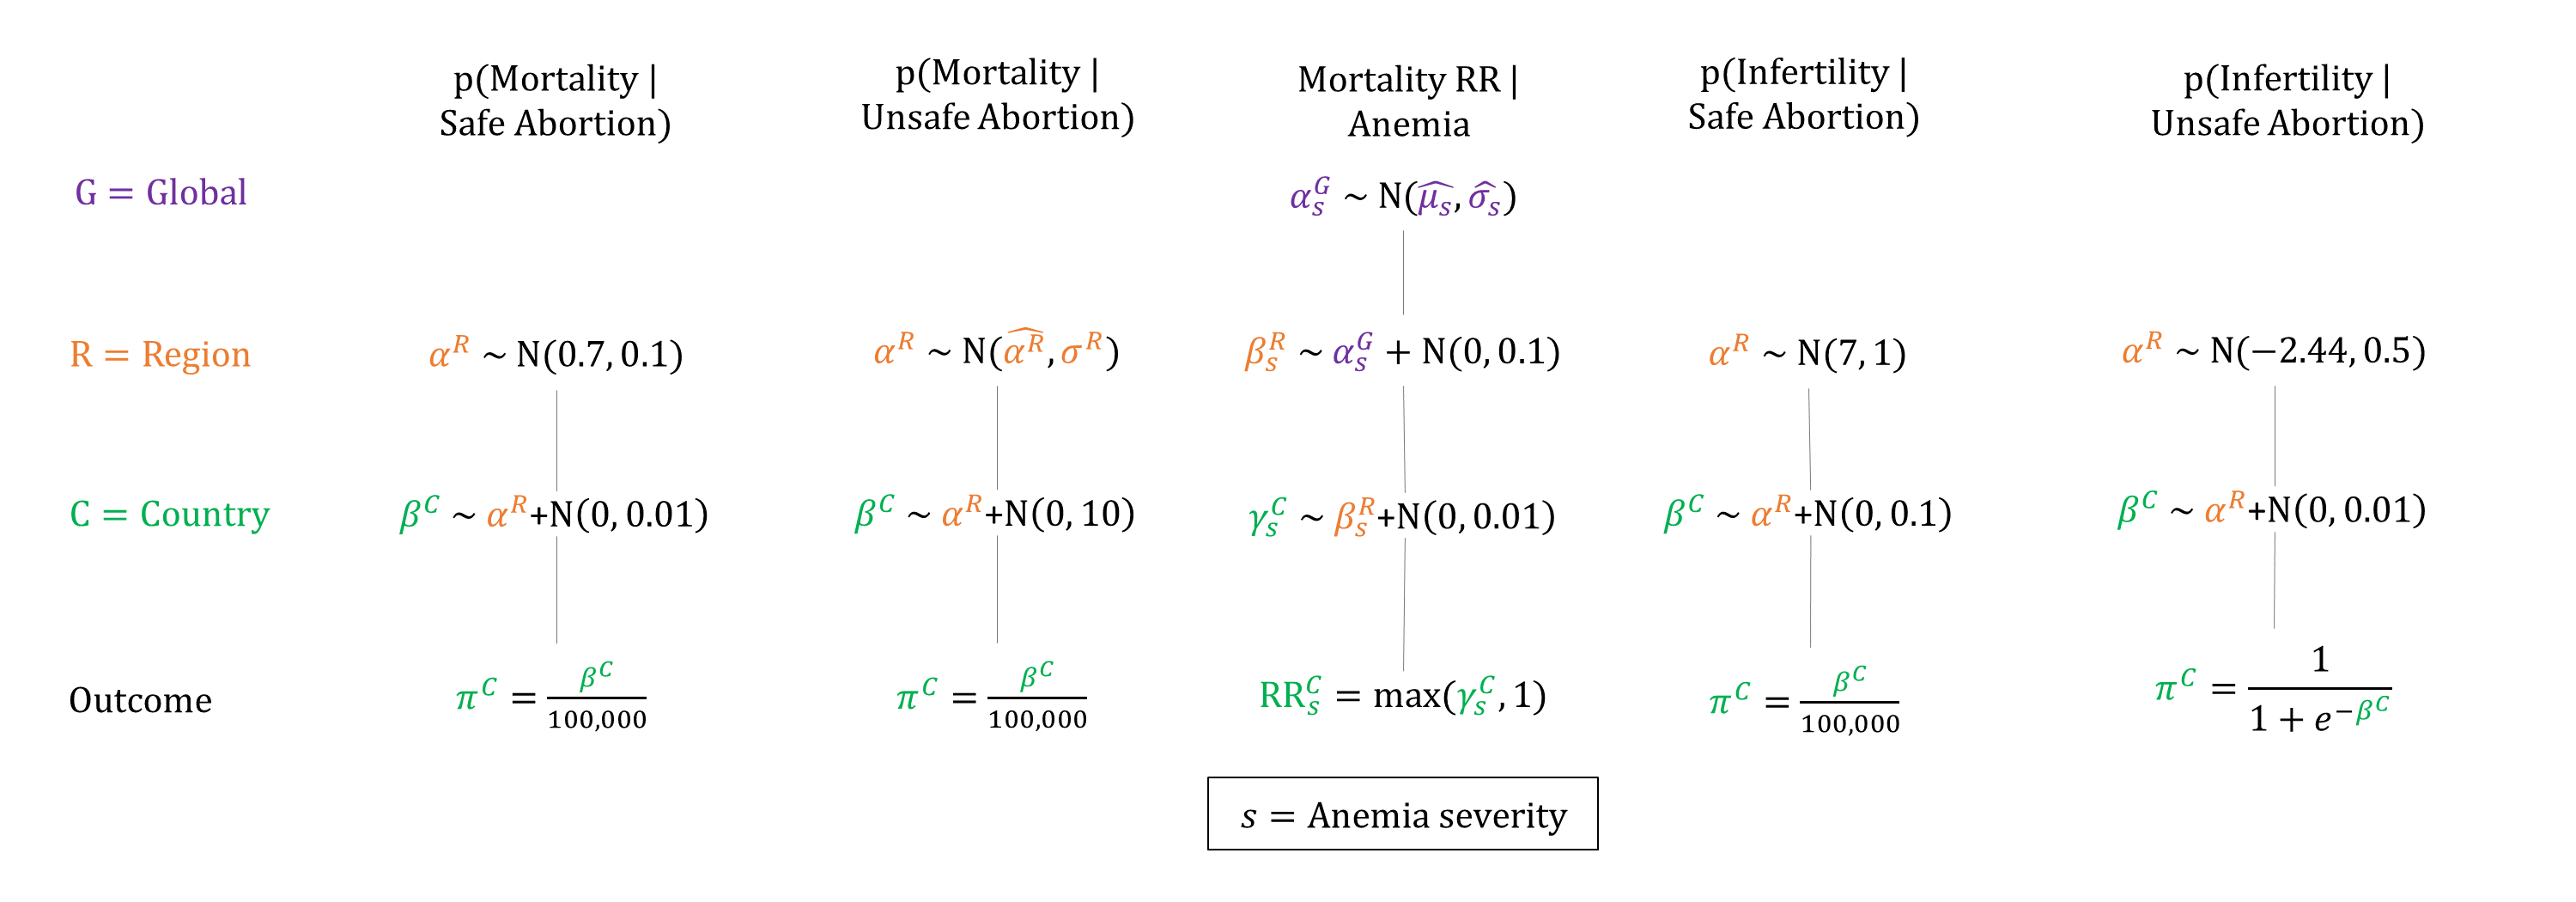
For mortality, we based region priors for safe abortion CFR on US estimates of abortion CFR, as nearly all abortions in North America are estimated to be ‘safe’. For unsafe abortion CFR, we based the priors on regional estimates from the WHO,[1] and set \(\sigma\) as 10% of the estimated CFR. To account for the relative risk of mortality from anemia, we set priors based on data from Brabin 2001.[13] Given that estimates of ‘near miss’ events are around 10 times higher than mortality, we set priors for infertility from safe abortion 10 times higher than the mortality estimates. For unsafe abortion we set priors based on the WHO estimates of 4%-12%.


Priors
Model Implementation
The chance of abortion is only simulated for women who do not want to become pregnant at the time of conception. The probability of abortion is adjusted if the fetus is a (singleton) female, based on the secondary sex ratio. If an abortion is simulated to occur, the gestational age is then drawn. We make the simplifying assumption that the distribution of gestational age at induced abortion follows that of spontaneous abortion (see Miscarriage). At the time of termination, the abortion is simulated to be either safe or unsafe. Risks of mortality are adjusted by a woman’s anemia severity. When sampling anemia RRs we ensured that they were at least 1.0, and non-decreasing by severity.
References
- WHO. Unsafe abortion. Global and regional estimates of incidence of unsafe abortion and associated mortality in 2008. 6th edn. Geneva: World Health Organization, 2011. Available: https://www.who.int/reproductivehealth/publications/unsafe_abortion/9789241501118/en/.
- Bearak J, Popinchalk A, Ganatra B, et al. Unintended pregnancy and abortion by income, region, and the legal status of abortion: estimates from a comprehensive model for 1990-2019. Lancet Glob Health 2020; 8(9): e1152-e1161. DOI: https://doi.org/10.1016/s2214-109x(20)30315-6
- Ganatra B, Gerdts C, Rossier C, et al. Global, regional, and subregional classification of abortions by safety, 2010-14: estimates from a Bayesian hierarchical model. Lancet 2017; 390(10110): 2372-2381. DOI: https://doi.org/10.1016/s0140-6736(17)31794-4
- Raymond EG, Grossman D, Weaver MA, Toti S, Winikoff B. Mortality of induced abortion, other outpatient surgical procedures and common activities in the United States. Contraception 2014; 90(5): 476–9. DOI: https://doi.org/10.1016/j.contraception.2014.07.012
- Zane S, Creanga AA, Berg CJ, et al. Abortion-related mortality in the United States: 1998–2010. Obstet Gynecol 2015; 126(2): 258–65. DOI: https://doi.org/10.1097/aog.0000000000000945
- Yokoe R, Rowe R, Choudhury SS, Rani A, Zahir F, Nair M. Unsafe abortion and abortion-related death among 1.8 million women in India. BMJ Glob Health 2019; 4(3): e001491. DOI: https://doi.org/10.1136/bmjgh-2019-001491
- Madziyire MG, Polis CB, Riley T, Sully EA, Owolabi O, Chipato T. Severity and management of postabortion complications among women in Zimbabwe, 2016: a cross-sectional study. BMJ Open 2018; 8(2): e019658. DOI: https://doi.org/10.1136/bmjopen-2017-019658
- Ishoso DK, Tshefu AK, Coppieters Y. Analysis of induced abortion-related complications in women admitted to referral health facilities in Kinshasa, Democratic Republic of the Congo. PLoS One 2018; 13(8): e0203186. DOI: https://doi.org/10.1371/journal.pone.0203186
- Calvert C, Owolabi OO, Yeung F. The magnitude and severity of abortion-related morbidity in settings with limited access to abortion services: a systematic review and meta-regression. BMJ Glob Health 2018; 3(3): e000692. DOI: https://doi.org/10.1136/bmjgh-2017-000692
- Männistö J, Mentula M, Bloigu A, Gissler M, Heikinheimo O, Niinimäki M. Induced abortion and future use of IVF treatment; A nationwide register study. PLoS One 2019; 14(11): e0225162. DOI: https://doi.org/10.1371/journal.pone.0225162
- AbouZahr C, Åhman E. Unsafe abortion and ectopic pregnancy. In: Murray CJL, Lopez AD, eds. Health dimensions of sex and reproduction: the global burden of sexually transmitted diseases, HIV, maternal conditions, perinatal disorders, and congenital anomalies. Cambridge, MA, Harvard University Press, 1998.
- Åhman E, Dolea C, Shah I. The global burden of unsafe abortion in the year 2000. Global Burden of Disease 2000. Available at: https://www.who.int/healthinfo/statistics/bod_abortions.pdf
- Brabin BJ, Hakimi M, Pelletier D. An analysis of anemia and pregnancy-related maternal mortality. J Nutr 2001; 131(2S-2): 604S-614S. DOI: https://doi.org/10.1093/jn/131.2.604s
GMatH (Global Maternal Health) Model - Last updated: 28 November 2022
© Copyright 2020-2022 Zachary J. Ward
zward@hsph.harvard.edu