
Contraception Failure Rates
Model Inputs \(\rightarrow\) Family Planning Parameters \(\rightarrow\) Contraception Failure Rates
Overview
Every method of contraception has some failure rate - that is, the chance that the user will become pregnant. Failure rates are typically calculated as the risk of becoming pregnant within 1 year under ‘perfect’ use or ‘typical’ use. Perfect use implies that the method is properly used in every instance, and so represents the maximum efficacy of a given method. Typical use refers to the general practice of usage. These two rates may be quite different if people fail to use methods properly and consistently. In the model we use estimates of typical use, as these better represent what is actually happening in the general population.
Data
Here we compare estimated failure rates from different sources. Trussell 2018[1] and Sundaram 2017[2] are based on data from the US, Moreau 2007[3] is based on data from France, and Bradley 2019[4] and Polis 2016[5,6] are based on analyses of DHS data from multiple countries.
Failure probability (within first year of typical use):
| Method | Trussell 2018[1] | Moreau 2007[3] | Sundaram 2017[2] | Bradley 2019[4] | Polis 2016[5,6] |
|---|---|---|---|---|---|
| No method | 85% | — | — | — | — |
| Pill | 7% | 2.4% (1.7%-3.2%) | 7.2% (0.68) | 6.3% (5.9%-6.8%) | 5.5% (3.5%-7.3%) |
| IUD | 0.1%-0.8% | 1.1% (0.5%-2.2%) | 1.4% (0.68) | 1.2% (0.9%-1.5%) | 1.4% (0.0%-2.4%) |
| Injections | 4% (Depo-Provera) | — | 4.0% (1.06) | 2.0% (1.7%-2.3%) | 1.7% (0.6%-2.9%) |
| Condom | 13% | 3.3% (2.4%-4.7%) | 12.6% (1.11) | 8.6% (7.6%-9.6%) | 5.4% (2.3%-8.7%) |
| Female sterilization | 0.5% | — | — | — | — |
| Male sterilization | 0.15% | — | — | — | — |
| Periodic abstinence | 15% | 7.7% (2.6%-21.5%) | — | 19.0% (17.4%-20.6%) | 13.9% (9.2%-19.3%) |
| Withdrawal | 20% | 10.1% (4.3%-22.5%) | 19.9% (2.03) | 17.3% (15.9%-18.7%) | 13.4% (9.1%-17.1%) |
| Implants | 0.1% (Nexplanon) | — | — | 0.3% (0.1%-0.9%) | 0.6% (0.0%-2.4%) |
| Other | — | — | — | — | — |
To estimate priors we pooled data on failure rates for 43 DHS countries,[5,6] and added estimates for the US[2] and France[3].
Within countries, failure rates vary by socioeconomic status, with the poorest and youngest women at highest risk of experiencing unintended pregnancy.[4] A similar gradient of failure rates by education level was found in France.[3]
Mortality Risk
As an invasive procedure, female sterilization has been associated with a risk of death, especially in developing countries.[7] Recent reports of mass deaths in sterilization camps in India highlight the concerns over poor quality of medical care when performing such procedures.[8,9] Mortality from sterilization has previously been estimated at between 2.5 and 10.0 per 100,000 procedures.[10] For calibration purposes, we do not currently incorporate any risk of morbidity/mortality from contraceptive methods, but this can be included in the model for future analyses.
Parameters
We estimated hierarchical logistic regression models for each method. We set the same priors for each subgroup within a country (urban/rural & education level), but constrained the sampled failure rates to be non-decreasing by increasing education level to account for the socioeconomic gradient in failure rates. We used the same global priors from ‘Withdrawal’ for ‘Other’ due to lack of data.
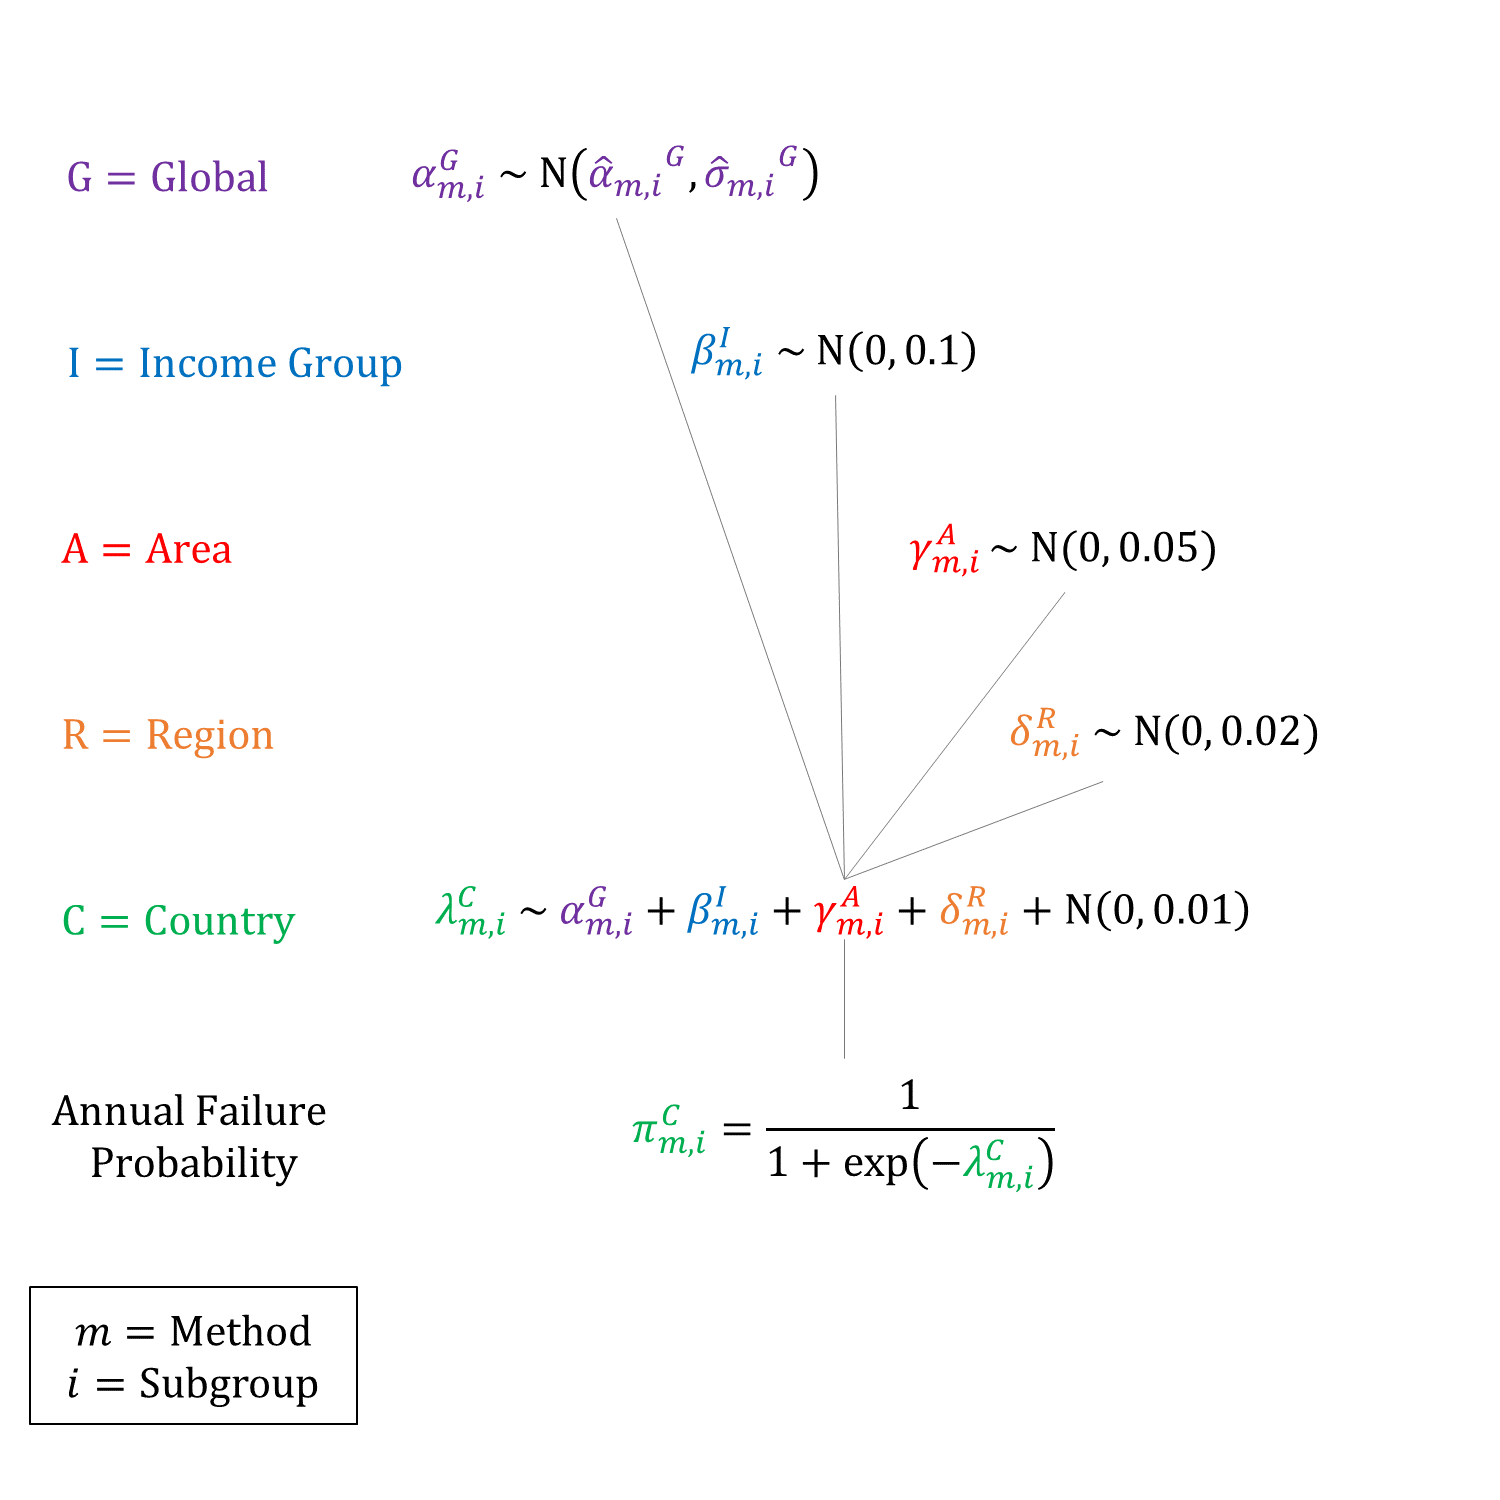
Priors
Model Implementation
To estimate the protective efficacy of each method we converted the annual failure probabilities to monthly rates and estimated relative rates compared to ‘No method’. The relative rates of average protective efficacy were then applied to the underlying age-specific natural fertility rates. We assume that the protective effects of LAM and contraception methods are independent. We also assume that the failure rate of each method is the same regardless of fertility intent (i.e. spacing or limiting).
References
- Trussell J, Aiken ARA, Micks E, Guthrie KA. Efficacy, safety, and personal considerations. In: Hatcher RA, Nelson AL, Trussell J, Cwiak C, Cason P, Policar MS, Edelman A, Aiken ARA, Marrazzo J, Kowal D, eds. Contraceptive technology. 21st ed. New York, NY: Ayer Company Publishers, Inc., 2018. Table available at: http://www.contraceptivetechnology.org/wp-content/uploads/2013/09/Contraceptive-Failure-Rates.pdf
- Sundaram A, Vaughan B, Kost K, Bankole A, Finer L, Singh S, Trussell J. Contraceptive Failure in the United States: Estimates from the 2006-2010 National Survey of Family Growth. Perspect Sex Reprod Health 2017; 49(1): 7-16. DOI: https://doi.org/10.1363/psrh.12017
- Moreau C, Trussell J, Rodriguez G, Bajos N, Bouyer J. Contraceptive failure rates in France: results from a population-based survey. Human Reprod 2007; 22(9): 2422-2427. DOI: https://doi.org/10.1093/humrep/dem184
- Bradley SEK, Polis CB, Bankole A, Croft T. Global Contraceptive Failure Rates: Who Is Most at Risk? Stud Fam Plann 2019; 50(1): 3-24. DOI: https://doi.org/10.1111/sifp.12085
- Polis CB, Bradley SE, Bankole A, Onda T, Croft T, Singh S. Typical-use contraceptive failure rates in 43 countries with Demographic and Health Survey data: summary of a detailed report. Contraception 2016; 94(1): 11-7. DOI: https://doi.org/10.1016/j.contraception.2016.03.011
- Polis C, Bradley SEK, Bankole A, et al. Contraceptive Failure Rates in the Developing World: An Analysis of Demographic and Health Survey Data in 43 Countries. Guttmacher Institute 2016. Available at: https://www.guttmacher.org/report/contraceptive-failure-rates-in-developing-world
- Aubert JM, Lubell I, Schima M. Mortality risk associated with female sterilization. Int J Gynaecol Obstet 1980;18(6):406-10. DOI: https://doi.org/10.1002/j.1879-3479.1980.tb00530.x
- Das A, Contractor S. India’s latest sterilisation camp massacre. BMJ 2014;349:g7282. DOI: https://doi.org/10.1136/bmj.g7282
- Pulla P. Why are women dying in India’s sterilisation camps? BMJ 2014;349:g7509. DOI: https://doi.org/10.1136/bmj.g7509
- Smith GL, Taylor GP, Smith KF. Comparative risks and costs of male and female sterilization. Am J Public Health 1985;75:370-374. DOI: https://doi.org/10.2105/ajph.75.4.370

GMatH (Global Maternal Health) Model - Last updated: 28 November 2022
© Copyright 2020-2022 Zachary J. Ward
zward@hsph.harvard.edu