Menopause
Model Inputs \(\rightarrow\) Biological Parameters \(\rightarrow\) Menopause
Overview
The transition into natural menopause typically begins in a woman’s mid-40s, when the function of the ovaries becomes inconsistent.[1,2] While age at natural menopause is a complex trait with high heritability,[3] older age at menopause typically reflects good overall health, whereas early menopause - generally defined as occurring before age 40 - can reflect poorer health.[4]
Data
A study of over 3,000 women from five racial/ethnic groups in the United States found that the median age of natural menopause was 52.5 years, and that women with higher education levels and good overall health tended to have a later age of menopause.[5] The study also found that menopausal age did not vary by race/ethnicity after controlling for behavioral and health variables.[5] For example, smoking is most consistently associated with earlier menopausal age, with studies showing that women who smoke stop menstruating an average of 1-2 years earlier than comparable nonsmokers.[6,7]
A systematic review and meta-analysis of 46 studies across 24 countries found a mean age of menopause of 48.8 years (95% CI 48.3-49.2), with lower ages in African, Latin American, Asian, and Middle Eastern countries, and higher ages in Europe, Australia, and the US.[8] Higher education was associated with later age at menopause, with a weighted mean difference of 0.64 years (95% CI 0.26-1.02) between women with high vs low education.[8]
Here we present the mean ages by continent as reported in Figure 2, Schoenaker 2014[8]:
| Continent | Mean Age (95% CI) |
|---|---|
| Africa | 48.38 (48.12 to 48.65) |
| Asia | 48.75 (48.08 to 49.42) |
| Australia | 51.25 (49.75 to 52.76) |
| Europe | 50.54 (50.04 to 51.05) |
| Latin America | 47.24 (45.88 to 48.60) |
| Middle East | 47.37 (46.91 to 47.84) |
| USA | 49.11 (48.78 to 49.43) |
Parameters
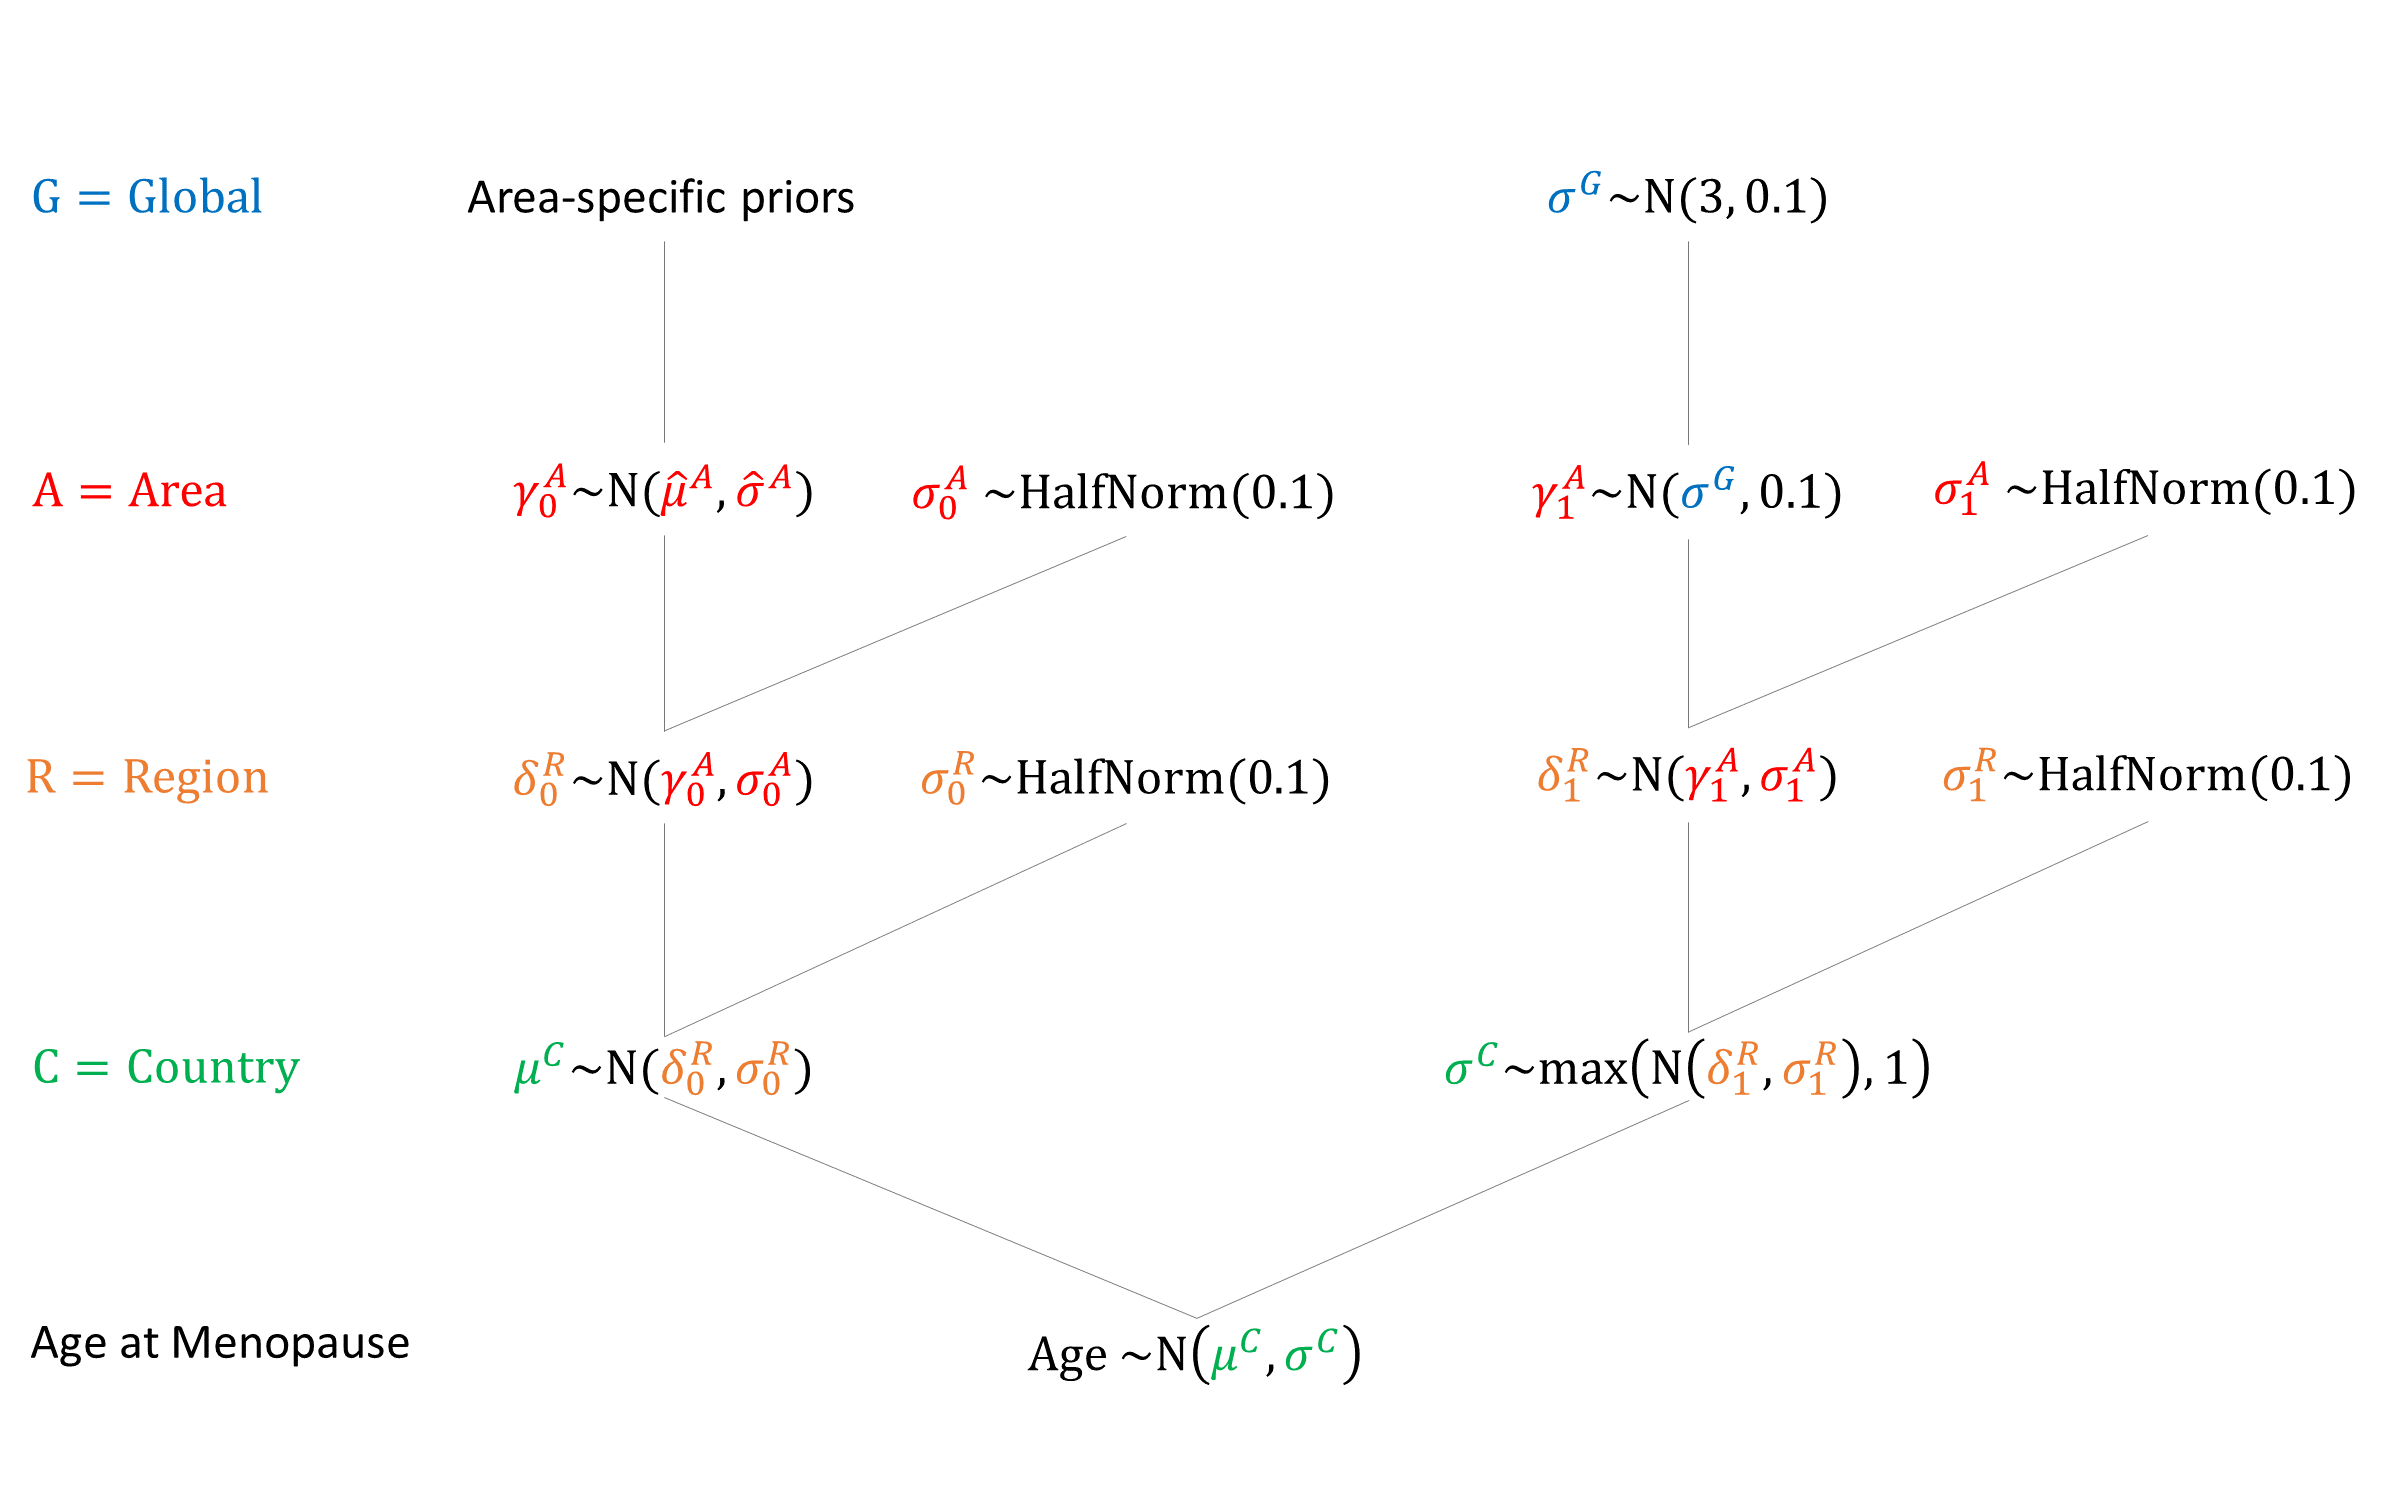
To account for country-specific factors we use a hierarchical model with the following area-specific priors:
| Area | Prior |
|---|---|
| Africa | \(N(48.38, 0.135)\) |
| Asia | \(N(48.75, 0.342)\) |
| Europe | \(N(50.54, 0.258)\) |
| Latin America | \(N(47.24, 0.694)\) |
| North America | \(N(49.11, 0.166)\) |
| Oceania | \(N(51.25, 0.768)\) |
Given the relatively small effect of education on age of menopause we do not include parameters to account for the impact of education in the interest of parsimony.
Gold 2013[5] plots estimated cumulative distributions of final menstrual period by age, showing a sigmoid curve from ages 42 to 60, implying a standard deviation of around 3. While age at menopause is generally skewed to the left (i.e. towards earlier ages), for simplicity we use a normal distribution. We impose a ceiling of age 60 on sampled age at menopause.

Priors
References
- Treloar AE. Menarche, menopause, and intervening fecundability. Hum Biol 1974; 46(1):89-107. PMID: https://www.ncbi.nlm.nih.gov/pubmed/4426598
- McKinlay SM, Brambilla DJ, Posner JG. The normal menopause transition. Maturitas 1992; 14(2):103-15. DOI: https://doi.org/10.1016/0378-5122(92)90003-m
- Shi J, Zhang B, Choi JY, et al. Age at menarche and age at natural menopause in East Asian women: a genome-wide association study. Age (Dordr) 2016; 38(5-6): 513-523. DOI: https://doi.org/10.1007/s11357-016-9939-5
- Schmidt CW. Age at Menopause: Do Chemical Exposures Play A Role? Environ Health Perspect 2017; 125(6): 062001. DOI: https://doi.org/10.1289/EHP2093
- Gold EB, Crawford SL, Avis NE, et al. Factors related to age at natural menopause: longitudinal analyses from SWAN. Am J Epidemiol 2013; 178(1):70-83. DOI: https://doi.org/10.1093/aje/kws421
- Gold EB. The timing of the age at which natural menopause occurs. Obstet Gynecol Clin North Am 2011; 38(3):425-40. DOI: https://doi.org/10.1016/j.ogc.2011.05.002
- Butts SF, Sammel MD, Greer C, Rebbeck TR, Boorman DW, Freeman EW. Cigarettes, genetic background, and menopausal timing: the presence of single nucleotide polymorphisms in cytochrome P450 genes is associated with increased risk of natural menopause in European-American smokers. Menopause 2014; 21(7):694-701. DOI: https://doi.org/10.1097/GME.0000000000000140
- Schoenaker DA, Jackson CA, Rowlands JV, Mishra GD. Socioeconomic position, lifestyle factors and age at natural menopause: a systematic review and meta-analyses of studies across six continents. Int J Epidemiol 2014; 43(5): 1542-62. DOI: https://doi.org/10.1093/ije/dyu094
GMatH (Global Maternal Health) Model - Last updated: 28 November 2022
© Copyright 2020-2022 Zachary J. Ward
zward@hsph.harvard.edu